MATHEMATICAL LITERACY PAPER 2 GRADE 12 MEMORANDUM - AMENDED SENIOR CERTIFICATE EXAM PAST PAPERS AND MEMOS MAY/JUNE 2016
Share via Whatsapp Join our WhatsApp Group Join our Telegram GroupMATHEMATICAL LITERACY PAPER 2
GRADE 12
MEMORANDUM
SENIOR CERTIFICATE EXAMINATIONS
2016
| Symbol | Explanation |
| M | Method |
| M/A | Method with accuracy |
| CA | Consistent accuracy |
| A | Accuracy |
| C | Conversion |
| S | Simplification |
| RT/RG | Reading from a table OR a graph |
| SF | Correct substitution in a formula |
| O | Opinion/reason/deduction |
| P | Penalty, e.g. for no units, incorrect rounding off etc. |
| R | Rounding off |
| NPR | No penalty for rounding |
| J | Justification |
QUESTION 1 [39 MARKS]
| Ques | Solution | Explanation | TL |
| 1.1.1 | Range = R62 500 – R29 890 ✓A✓M = R32 610 ✓CA | 1A correct values 1M subtracting 1CA range AO (3) | D L2 |
| 1.1.2 | Mean = Sum of all scores R36586,11 = R43320 + R33100 + Z + R29730 + R46000 + R35300 + R35970 ✓M | 1M adding all correct values 1A dividing by 7 1M subtracting 1CA simplification 1R rounding to nearest rand AO (5) | D L2 |
| 1.1.3 | NMMU does not offer these degree courses. ✓✓O OR No students attending✓✓O OR No students took the course✓✓O | 2O reason (2) | D L4 |
| 1.1.4 | Percentagr Increase = 2016Fee - 2015Fee × 100% ✓M 2015Fee = R69000 - R46000 × 100% ✓M R46000 = 50% ✓CA 50% ÷ 6,7% = 7,462686567 ✓M✓CA The student is correct; it is more than seven times the projected inflation rate.✓O OR R 69 000 – R46 00 = R 23 0000 ✓M✓A 6,7 × R46000 = R3082✓M✓A 100 R 3 082 × 7 = R 21 574 ✓CA The student is correct ✓O OR 6,7% × 7 = 46,9% ✓M✓A R 46 000 × 46,9% = R 21 574 ✓A R 46 000 + R 21 574 = R 67 574 ✓M R 69 000 – R 67 574 = R 1 426 more ✓CA Student is correct. ✓O | 1M substituting correct values 1M for subtracting | F L4 (6) |
| 1.1.5 | R 46 000 × 10,75 % = R 4 945 ✓M R 46 000 + R 4 945 = R 50 945 ✓CA R 50 945 × 10,75% = R 5 476,59 R 50 945 + R 5 476,59 = R 56 421,59 Monthly fee = R38 × 24 = R912 ✓A Total cost of loan = R56 421,59 + R912 + R300 ✓M = R57 633,59 Difference in amounts = R57 633,59 – R46 000 = R11 633,59 ✓O He is correct. OR Total capital + interest = R46 000 × 110,75% × 110,75% ✓M✓M = R56 421,59 ✓CA Monthly fee = R38 × 24 = R912 ✓A Total cost of loan = R56 421,59 + R912 + R300 ✓M = R57 633,59 ✓CA Difference in amounts = R57 633,59 – R46 000 ✓M = R11 633,59 He is correct. ✓O | 1M for calculating interest 1CA for principal 1CA accumulated value 1A calculating the monthly fee for 24 months 1M adding all values 1CA total cost of loan 1M subtracting the amounts 1O verification OR 2M multiplying by 110,75% 1CA answer 1A calculating the monthly fee for 24 months 1M adding all values 1CA total cost of loan 1M subtracting the amounts 1O verification (8) | F L3(7) |
| 1.2.1 | Volume of fabric paint container = π × radius × radius × height 367,38 cm3 3,142 × 3 cm ×3 cm × height ✓M✓SF 367,38 cm3 = 28,278 × height ✓CA 367,38 cm3 ÷ 28,278 = height ✓M height = 12,9917 cm = 129,92 mm ✓C | 1M calculating radius 1SF substituting into formula 1CA simplification 1M dividing by 28,278 1C converting to mm NPR (5) | M L3 |
| 1.2.2 | Area of one letter E = (length × width) – (side × side × 2) = (29,5 × 19,5) – (5,9 × 5,9 × 2) ✓M✓M = 505,63 cm2 Amount of paint needed for one letter E = 505, 63 ÷ 10 000 × 100 ✓C✓M = 5,0563 mℓ ✓CA Amount of paint needed for four letter E's = 5,0561 × 4 = 20,2252 mℓ ✓CA OR Area of letter E = (length ×width) + ( side × side × 3) ✓M = (29,5 cm × 13,6 cm) + (5,9 cm × 5,9 ×3) ✓M = 505,63 cm2 ✓CA = 506 cm2 Amount of paint needed for one letter E = 505, 63 ÷ 10 000 × 100 ✓C✓M = 5,0563 mℓ ✓CA Amount of paint needed for four letter E's = 5,0561 × 4 = 20,2252 mℓ✓CA | 2M using formula for two areas 1CA calculating area 1C converting to m² 1M converting to mℓ 1CA calculating paint 1CA total volume NPR OR 2M using formula for two areas 1CA calculating area 1C converting to m² 1M converting to mℓ 1CA calculating paint 1CA total volume (7) | M L3 |
| 1.2.3 | Perimeter of letter E = 29,5 cm + 19,5 cm +19,5 cm + (9 × 5,9 cm)✓M✓A = 121,6 cm✓CA OR Perimeter of letter E = 2 × 29,5 cm + (2 × 19,5 cm ) + (4 × 5,9 cm) ✓M✓A = 121,6 cm✓CA | 1A reading all values 1M adding 1CA perimeter OR 1A reading all values 1M adding 1CA perimeter (3) | M L2 |
[39]
QUESTION 2 [26 MARKS]
| Ques | Solution | Explanation | TL |
| 2.1.1 | Final salary = R26 578 × 12 ✓MA = R318 936 ✓A Gratuity = 6,72% × final salary per year × years of pensionable service = 6,72% × R318 936 × 33 ✓SF = R707 272,4736 = R707 272 ✓R OR Final salary = R 26 578 × 6,72% ×12 × 33 ✓MA ✓MA = R 707 272,473 ✓A = R 707 272 ✓R | 1MA multiplying by 12 1A salary 1SF substituting correct values in formula 1R rounding to the nearest rand OR 1MA multiplying by 12 1MA multiplying by 6,72% and 33 1A salary 1R rounding to the nearest rand (4) | F L2 |
| 2.1.2 (a) | Annuity (p.a.) = (1× final salary × years of pensionable service) + 360 55 = (1× R26578 × 12 × 33) + 360 ✓SF 55 = R191 721,60 ✓CA Tax payable per annum = R32 742 + 26% × (R191 721,60 – R181 900) ✓M✓SF = R35 295,62 – R13 257 ✓CA = R22 038,62 ✓CA Annuity after tax = R191 721,60 – R22 038,62 ✓M Monthly annuity = R169 682,98 ÷ 12 ✓M = R14 140,25 ✓CA | CA from answer in Q 2.1.1 1SF substituting correct values into formula 1CA calculating the annuity p.a. 1M correct tax bracket 1SF substituting correct values into formula CA tax before rebate 1CA calculating the tax due per year 1M subtracting tax due from yearly income 1M dividing by 12 1CA monthly income after tax (9) | F L3 |
| 2.1.2 (b) | Difference in income = R26 578 – R14 140,25 ✓M
He can retire✓O
| 1M subtracting 1CA difference 1O stating conclusion 1J Any one of the listed bullets (4) | F L4 |
| 2.2.1 | No money for transport = 100% – (11,0% + 8,7% + 4% + 73%)✓M/A✓MA = 3,3% P = 3,3% OR 0,033 OR 3,3 OR 33 ✓CA✓CA✓CA✓CA 100 1000 | 1MA pie chart concept 1MA adding correct values 1CA probability AO (3) | P L3 |
| 2.2.2 | The number of boys with other reasons is very small and will not account for a sector on the pie chart. ✓O | 2O opinion (2) | D L4 |
| 2.2.3 | During the examination period learners do not come to school on the days they are not writing. ✓✓O OR They do not prepare for the examinations.✓✓O OR Afraid of writing.✓✓O OR Studying at home.✓✓O OR They bunk classes.✓✓O | 2O reason (2) | D L4 |
| 2.2.4 | The pie charts only give percentages and not actual numbers.✓✓O | 2O Opinion (2) | D L4 |
[26]
QUESTION 3 [42 MARKS]
| Ques | Solution | Explanation | TL |
| 3.1.1 | Gauteng and North West ✓✓A✓✓A | 2A for 1st province 2A for 2nd province (4) | MAP L2 |
| 3.1.2 | De Hoop Limpopo ✓A✓A Any two correct pairs 4 marks | 1A correct dam 1A correct province 1A correct dam 1A correct province (4) | MAP L2 |
| 3.1.3 | P = 5 OR 0,32 OR 31% ✓✓A✓A ✓✓✓A ✓✓✓A 16 | 2A numerator 1A denominator AO (3) | P L3 |
| 3.1.4 | 2014 5 340 000 megalitres × 67,9% = 3 625 860 megalitres ✓MA✓CA 2015 5 340 000 megalitres × 58,7% = 3 134 580 megalitres✓CA Difference = 3 625 860 megalitres – 3 134 580 megalitres = 491 280 megalitres✓CA = 491 280 000 kilolitres✓C OR 67,9% – 58,7% = 9,2% ✓A 9,2% × 5 340 000 megalitres✓M = 491 280 megalitres✓CA = 491 280 000 kilolitres✓C | 1MA multiply with % 1CA answer(2014) in megalitres 1CA answer (2015) in megalitres 1CA calculating the difference 1C conversion OR 1M subtracting correct percentages 1A simplification 1M multiplying by 9,2% 1CAcalculating the difference 1C conversion (5) | M L3 |
| 3.1.5 | Low rainfall ✓✓O OR No rainfall✓✓O OR Drought✓✓O OR Evaporation✓✓O OR Water usage for human activities✓✓O OR Bad infrastructure✓✓O OR Leakages✓✓O OR Population increases✓✓O OR Climatic changes✓✓O OR Agriculture✓✓O OR Global warming✓✓O | 2O first reason 2O second reason (4) | M L4 |
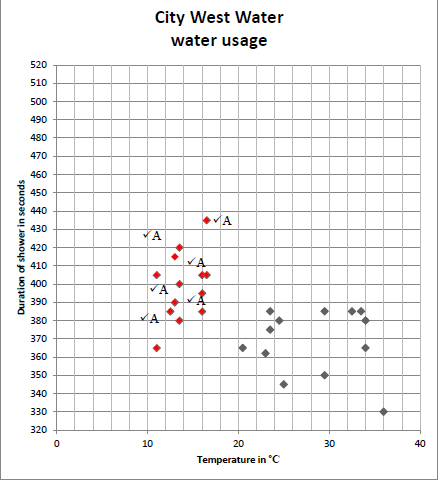
| 3.2.1 |
One mark for every two correctly plotted points | D L 2 | |
| 3.2.2 | In the summer/high temperature the duration of the shower time decrease.✓A✓✓O OR In the winter/low temperature the duration of the shower time increase.✓A✓✓O | 1A high temp. 2O time decrease (3) | D L 4 |
| 3.2.3 | The authorities must provide more water in the winter months for showering as people use more water to shower in the winter months.✓✓O OR They can educate people not to run the water in the shower to heat up the bathroom in the winter months, but to use other heating methods.✓✓O OR Build bigger dams.✓✓O OR Educate people to save water.✓✓O | 2O for any valid reason (2) | D L4 |
| 3.2.4 | This is not a representative sample because the sample is too small.✓✓O | 2O for stating that the sample is too small (2) | D L4 |
| 3.2.5 | 7 minute 10 seconds = 430 seconds ✓C 11 ✓A✓A 26 | 1C converting to seconds 1A numerator 1A denominator Accept denominator of 52 Answer in decimal form full marks (3) | P L2 |
| 3.2.6 | Winter shower duration Lower quartile = 385✓A Upper quartile = 410✓A IQR = 410 – 385✓M = 25✓CA Summer shower duration IQR = 29 Difference = 29 – 25 ✓M = 4✓CA | 1A reading the lower quartile 1A reading the upper quartile 1M subtracting 1CA IQR 1M subtraction 1CA difference Accept Lower quartile 380 Upper quartile 405 (6) | D L3 |
[42]
QUESTION 4 [43 MARKS]
| Ques | Solution | Explanation | HL |
| 4.1.1 (a) | Rental for 2-berth vehicle (unlimited km) = (R1 225 + R220) × 8 ✓MA = R11 560 ✓CA Rental per person = R11 560 ÷ 3 ✓M = R3 853,33✓CA | 1MA adding and multiplying 1CA rental cost 1M dividing by 3 1CA rental per person (4) | F L2 |
| 4.1.1 (b) | Rental for 2-berth vehicle (limited km) = (R1 050 + R220) × 7 ✓M = R8 890✓CA Free kilometres = 300 × 7 = 2 100✓A Extra kilometres = 3 050 km – 2 100 km✓M = 950 km✓CA Cost for extra km = 950 km × R3,50 = R3 325✓CA Total cost = R8 890 + R3 325 = R12 215✓CA ∴ The 8-day option is the most economical. ✓O | 1M adding and multiplying 1CA rental cost 1A free kilometres 1M subtracting values 1CA extra km 1CA extra cost 1CA total cost 1O comparing and giving advice Use Q4.1.1.(a) answer for opinion mark (8) | F L4 |
| 4.1.2 | Length of bed on plan = 2,010 m ÷ 80 ✓M = 0,025125 m × 1 000 = 25,125 mm✓C = 25 mm✓R | 1M working with ratio(dividing by 80) 1C for answer in mm 1R rounding to nearest mm AO 25mm (3) | Map L3 |
| 4.1.3 | 4-berth vehicle Amount of diesel used = 3 050 km × 0,1321 ℓ/km✓M = 402,905 ℓ✓CA Cost of diesel = 402,905 ℓ × R11,78/ℓ = R4 746,22✓CA 2-berth vehicle Amount of diesel used = 3 050 km ÷ 10,362 km/ℓ✓M = 294,3447211 ℓ✓CA Cost of diesel = 294,3447211 ℓ × R11,78/ℓ = R3 467,38 Difference in cost = R4 746,22 – R3 467,38✓M = R1 278,84✓CA Maria is correct; they will be saving R1 278,84 on the cost of diesel.✓✓O | 1M multiplying by rate 1CA amount of diesel used 1CA cost of diesel 1M dividing by the rate 1CA amount of diesel used. 1CA cost of diesel 1M subtracting 1CA difference 2O for stating that Maria is correct NPR (10) | F L4 |
| 4.2.1 (a) | Full tank can drive: 50 × 10,362 km = 518,1 km ✓M✓CA Distance from Bloemfontein to Kimberley = 175 km✓RT Total distance from Harrismith to Kimberley = 337 km + 175 km = 512 km✓CA 512 km is less than 518,1 km. ✓O OR Full tank can drive: 50 × 10,362 km = 518,1 km✓M✓CA Distance on map from Kimberley to Bloemfontein = 15 mm Scale 22 mm = 300 km / 3mm = 50 km / 9 mm = 100 km Distance from Kimberley to Bloemfontein in km =15mm300km = 15mm50km = 15mm100km ✓M 22mm 3mm 9mm = 204,55 km = 250 km = 166,67 km Total distance from Harrismith to Kimberley = (337+ 204,55) km = (337 + 250) km = (337 +166,67) km = 542,55 km =587 km = 503,67 km ✓CA 542 > 518,1 587 > 518,1 503,67 < 518,1 ✓O | 1M multiplying 1CA distance 1RT reading of distance 1CA total distance 1O conclusion OR 1M multiplying 1CA distance 1M calculating distance using bar scale 1CA total distance 1O conclusion Allow ± 1mm (5) | Maps L2 |
| 4.2.1 (b) | Distance from Kimberley to Upington = 401 km ✓RT Scale on map: 9 mm = 100 km ✓MA Length on map from Upington to Kakamas = 9 mm ✓M Distance from Upington to Kakamas = 100 km✓CA Total distance: Kimberley to Kakamas = 401 km + 100 km = 501 km ✓CA 501 km is less than 518,1 km. ✓O | 1RT reading of distance 1MA measuring scale 1MA measuring 1CA calculating the distance 1CA total 1O Stating less than 518,1 km (6) | Maps L4 |
| 4.2.2 | Time = Distance ÷ speed = 1 300 km ÷ 94 km/h✓CA✓M = 13,82978723 ≈ 13 hours and 50 minutes✓CA Time on road + breaks = 13 hours + 50 minutes + 2 × 20 minutes + 2¼ + 180 minutes✓M = 19 hours and 45 minutes✓CA Time of arrival = 00:45 Tuesday✓CA✓CA OR Total distance from Harrismith to Springbok = 512 km + 800 km = 1 312 km✓CA Distance = speed × time 1 312 km = 94 Km/h × time Time = 13,95744681 hours✓M = 13 hours 57 minutes✓CA Time on road + breaks = 13 hours + 57 minutes + 2 × 20 minutes + 2¼ + 180 minutes ✓M = 19 hours and 45 minutes✓CA Time of arrival = 00:52 Tuesday ✓CA✓CA | 1CA distance 1M dividing by speed 1CA hours and minutes 1M adding all the times 1CA total time spent on road 1CA time of arrival 1CA day of arrival OR 1CA distance 1M dividing by speed 1CA hours and minutes 1M adding all the times 1CA total time spent on road 1CA time of arrival 1CA day of arrival (7) | M L3 |
[43]
TOTAL: 150