GEOGRAPHY with Memorandum - 2024 Grade 12 June Common Exams
Share via Whatsapp Join our WhatsApp Group Join our Telegram GroupMARKS: 150
TIME: 3 hours
INSTRUCTIONS AND INFORMATION
- This question paper consists of TWO SECTIONS.
- SECTION A
- QUESTION 1: CLIMATE AND WEATHER (40)
- QUESTION 2: GEOMORPHOLOGY (40)
- QUESTION 3: SETTLEMENT (40)
- SECTION B
- QUESTION 4: GEOGRAPHICAL SKILLS AND TECHNIQUES (30)
- SECTION A
- Answer all FOUR questions.
- ALL diagrams are included in the question paper.
- Leave a line between subsections of questions answered.
- Start EACH question at the top of a NEW page.
- Number the answers correctly according to the numbering system used in this question paper.
- Do NOT write in the margins of the ANSWER BOOK.
- Draw fully labelled diagrams when instructed to do so.
- Answer in FULL SENTENCES, except when you have to state, name, identify or list.
- Units of measurement MUST be indicated in your final answer, e.g. 1 020 hPa, 14 °C and 45 m.
- You may use a non-programmable calculator.
- You may use a magnifying glass.
- Write neatly and legibly.
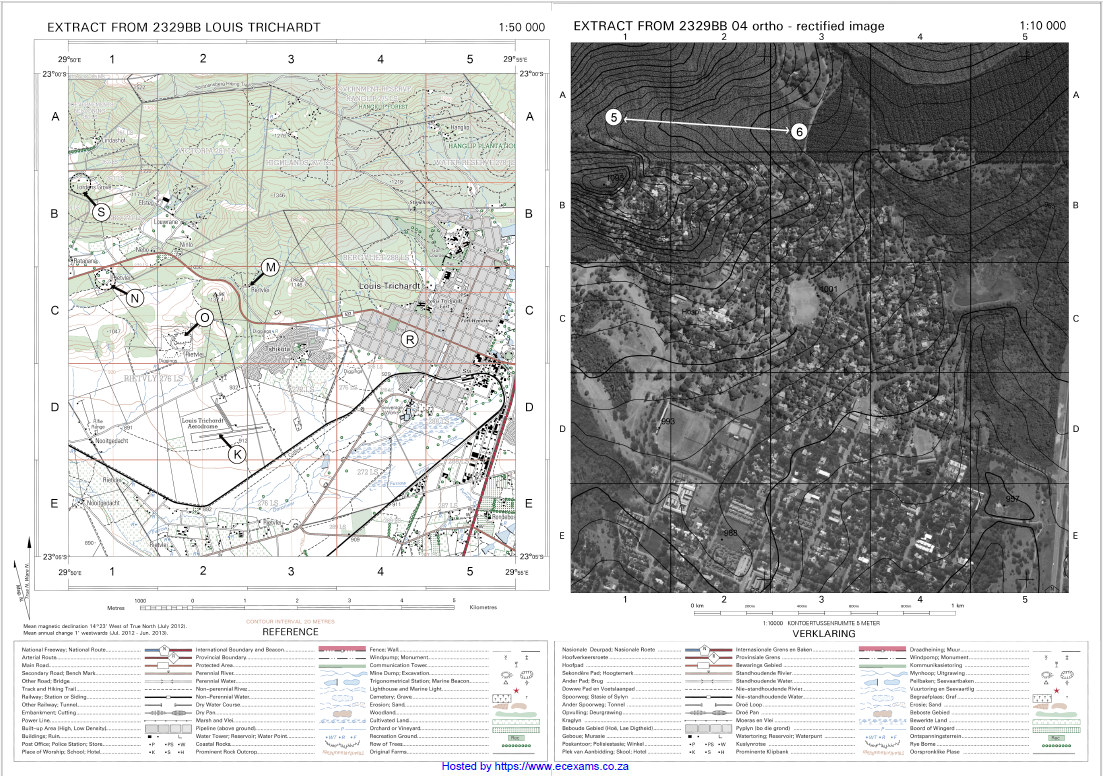
SPECIFIC INSTRUCTIONS AND INFORMATION FOR SECTION B - A 1 : 50 000 topographical map 2329BB LOUIS TRICHARDT and a 1 : 10 000 orthophoto map (2329 BB 04) LOUIS TRICHARDT are provided.
- The area demarcated in RED on the topographic map represents the area covered by the orthophoto map.
- Marks will be allocated for steps in calculations.
- You must hand in the topographical and the orthophoto map to the invigilator at the end of this examination session.
SECTION A
QUESTION 1: CLIMATE AND WEATHER
1.1 Various options are provided as possible answers to the following questions. Choose the answer and write only the letter (A–D) next to the question numbers (1.1.1 to 1.1.5) in the ANSWER BOOK, for example 1.1.6 D.
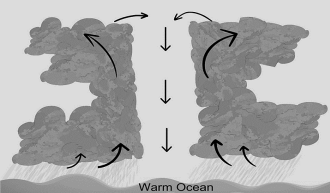
Refer to the cross section of a tropical cyclone to answer QUESTIONS 1.1.1–1.1.3.
[Adapted from www.faculty.luther.edu/~bernatzr/Courses/Chapter13/tropCyc]
1.1.1 The ... stage of development is depicted.
A immature
B initial
C mature
D dissipating
1.1.2 The descending air in the eye is dry because of:
(i) Condensation
(ii) Adiabatic heating
(iii) No condensation
(iv) Adiabatic cooling
A (i) and (iv)
B (iii) and (iv)
C (i) and (ii)
D (ii) and (iii)
1.1.3 The following weather condition is associated with the eye:
A Heavy rain
B Cumulonimbus clouds
C Strong winds
D High temperature
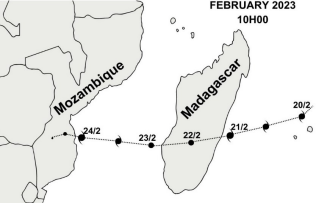
Refer to the map showing the path of tropical cyclone Freddy to answer QUESTIONS 1.1.4 and 1.1.5.
[Adapted from www.iol.co.za/dailynews/news]
1.1.4 The life cycle of tropical cyclone Freddy was … days.
A 7
B 11
C 24
D 5
1.1.5 Tropical cyclone Freddy dissipated when it moved over Mozambique on 24/2/2023 because of:
(i) decreased latent heat
(ii) increased latent heat
(iii) decreased friction
(iv) increased friction
A (i) and (iii)
B (i) and (iv)
C (ii) and (iii)
D (ii) and (iv) (5 x 1) (5)
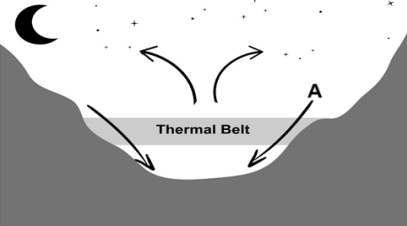
1.2 Refer to the sketch depicting a valley climate and choose the answer to complete the sentences.
[Adapted from Online.hteseden.co.za]
1.2.1 (Solar / Terrestrial) radiation causes air at A to cool.
1.2.2 The wind at A is an/a (anabatic / katabatic) wind.
1.2.3 As the altitude in the thermal belt increases, the temperature (decreases / increases).
1.2.4 The wind at A will be more intense in (summer / winter).
1.2.5 (Frost / Radiation fog) forms at the bottom of the valley when dew point temperature drops below 0 °C. (5 x 1) (5)
1.3 Refer to the sketches below on a mid-latitude cyclone.
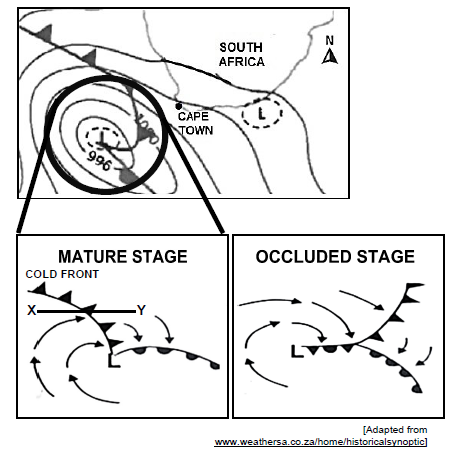
1.3.1 In what stage of formation is the mid-latitude cyclone that is approaching Cape Town? (1 x 1) (1)
1.3.2 Why is Cape Town currently experiencing higher temperatures compared to the air behind the cold front? (1 x 1) (1)
1.3.3 How will the wind direction change as the cold front passes over Cape Town? (1 x 2) (2)
1.3.4 Give a reason for your answer to QUESTION 1.3.3. (1 x 2) (2)
1.3.5 Draw a cross profile from X to Y of the cold front. Clearly indicate the air movement, cloud type and weather. (3 x 1) (3)
1.3.6 Explain the development of the cold front occlusion which will lead to the dissipation of the mid-latitude cyclone. (3 x 2) (6)
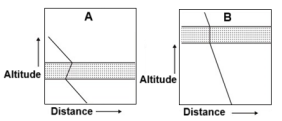
1.4 Refer to the sketches below based on changes in the position of the inversion layer over South Africa.
|
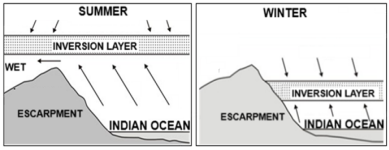
[Adapted from //slideplayer.com/.+High+Pressure+Systems.jpg]
1.4.1 What is an inversion layer? (1 x 2) (2)
1.4.2 Which graph, A or B, depicts winter conditions? (1 x 1) (1)
1.4.3 Give a reason for the position of the inversion layer during winter. (1 x 2) (2)
1.4.4 What climatic conditions experienced over the plateau during winter could be unfavourable for farmers? (2 x 1) (2)
1.4.5 In a paragraph of approximately EIGHT lines, explain how the subtropical anticyclones influence the climate over the interior of South Africa during summer. (4 x 2) (8) [40]
QUESTION 2: GEOMORPHOLOGY
2.1 Match the descriptions in QUESTION 2.1.1 to 2.1.5 with the cross profile of river type A, B or C. Write only the letter (A, B or C) next to the question numbers (2.1.1 to 2.1.5) in your ANSWER BOOK, for example 2.1.6 B.
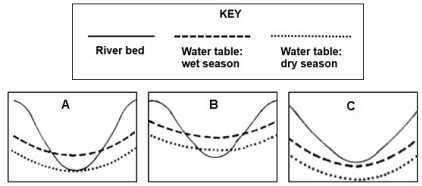
[Adapted from nationalgeographic.org/resource/water-tables]
2.1.1 Flows only in the rainy season
2.1.2 Constant supply of groundwater
2.1.3 Never receives base flow
2.1.4 Flows only after heavy rainfall
2.1.5 Flows all year (5 x 1) (5)
2.2 Refer to the sketch below of fluvial landforms. Complete the statements in COLUMN A with an option in COLUMN B. Write only X or Z next to the question numbers (2.2.1 to 2.2.5) in the ANSWER BOOK, for example 2.2.6 Z.
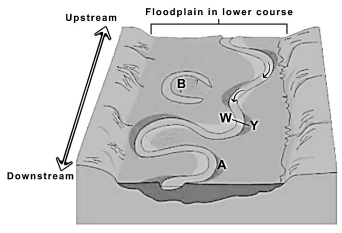
[Adapted from https://quizlet.com/fomation-of-meander/]
COLUMN A | COLUMN B |
2.2.1 The dominant fluvial process of the river channel at A: | X Lateral erosion Z Vertical erosion |
2.2.2 A meander loop that is cut off from the main river (B): | X Meander scar Z Oxbow lake |
2.2.3 Over time, these meanders will migrate … | X upstream Z downstream |
2.2.4 The water velocity will be … at Y in comparison to W. | X faster Z slower |
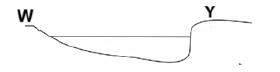
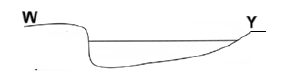
2.2.5 The cross profile of the river channel (W–Y): | X Z |
(5 x 1) (5)
2.3 Refer to the sketches based on two drainage basins.
DRAINAGE BASIN A DRAINAGE BASIN B
[Source: Examiner’s own sketch] |
2.3.1 What is a drainage basin? (1 x 2) (2)
2.3.2 Which drainage basin (A or B) has a higher stream order? (1 x 1) (1) Refer to drainage basin A.
2.3.3 State the relationship between the number of streams and the stream order. (1 x 2) (2)
2.3.4 How will more fingertip (first order) streams impact the drainage density? (1 x 2) (2)
2.3.5 In a paragraph of approximately EIGHT lines, explain why drainage basin B has a lower drainage density compared to drainage basin A. (4 x 2) (8)
2.4 Refer to the case study and map below on catchment and river management.
THE DETERIORATED STATE OF THE MTHATHA RIVER The water quality of the Mthatha River shows trends of deterioration as the river progresses downstream, suggesting that the river gets polluted as it passes through the city of Mthatha. Untreated or inadequately treated sewage, polluted runoff from informal settlements and industrial waste, contribute largely to the deterioration of water quality. Contaminated water negatively affects the natural environment and the communities who depend on river water for their basic domestic needs. The ecological state of the river at X (downstream of Mthatha on the map), reveals the serious problems that face the river system. Restoring and maintaining the catchment to a healthy state is essential in terms of its ability to support natural plants and animals, and its capacity to provide a variety of goods and services.
[Adapted from www.dws.gov.za/iwqs/rhp/state_of_rivers/posters/Mthatha-6-e.pdf] |
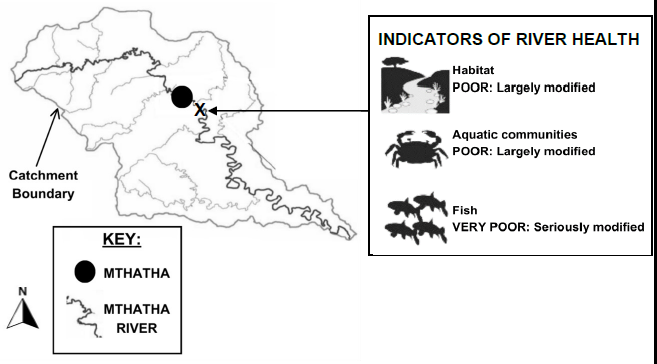
2.4.1 Where is the Mthatha River’s water quality better; downstream or upstream of Mthatha? (1 x 1) (1)
2.4.2 Refer to the case study and identify TWO sources that negatively impact the quality of water of the Mthatha River. (2 x 1) (2)
2.4.3 Why is it important to study the indicators of river health at X? (1 x 2) (2)
2.4.4 Explain how contaminated water (at X) negatively affects the natural environment. (2 x 2) (4)
2.4.5 Suggest THREE strategies that can be implemented to improve and maintain the water quality in the Mthatha River Catchment area. (3 x 2) (6) [40]
QUESTION 3: RURAL AND URBAN SETTLEMENTS
3.1 The graph below shows the proportion of people living in South African urban areas. Various options are provided as possible answers to the following questions. Choose the answer and write only the letter (A–D) next to the question numbers (3.1.1 to 3.1.5) in the ANSWER BOOK, for example 3.1.6 D.
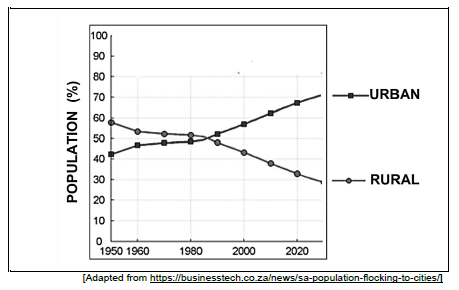
3.1.1 The process by which an increasing percentage of South Africa’s population lives in urban areas:
A Urbanisation
B Rate of urbanisation
C Rural-urban migration
D Level of urbanisation
3.1.2 South Africa’s approximate level of urbanisation in 2020:
A 68 million
B 32%
C 68%
D 36%
3.1.3 The rate of urbanisation was lowest between the following years:
A 2000 and 2010
B 1970 and 1980
C 1950 and 1960
D 2010 and 2020
3.1.4 The increase in the number of people living in urban areas:
A Urban expansion
B Urban sprawl
C Rate of urbanisation
D Urban growth
3.1.5 The causes of urbanisation in South Africa are:
(i) High rate of emigration from South Africa
(ii) High rate of immigration into South Africa
(iii) Rural-urban migration
(iv) Urban-rural migration
A (i) and (iii)
B (ii) and (iii)
C (i) and (iv)
D (ii) and (iv) (5 x 1) (5)
3.2 Refer to figures A and B which represent two different types of goods / services provided by a central place. Match the descriptions in QUESTION 3.2.1 to 3.2.5 with A or B. Write down only A or B next to the question numbers (3.2.1 to 3.2.5) in the ANSWER BOOK, for example 3.2.6 A.
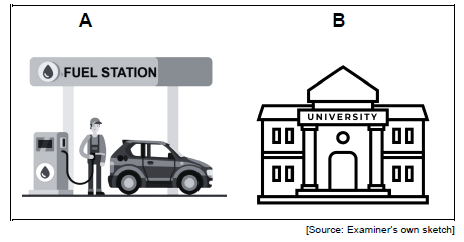
3.2.1 Has a smaller range
3.2.2 Has a larger threshold population
3.2.3 Required less frequently
3.2.4 Serves a larger sphere of influence
3.2.5 Relatively inexpensive (5 x 1) (5)
3.3 Refer to the extract on rural settlement issues.
NEGLECTED RURAL INFRASTRUCTURE: A CRITICAL OVERSIGHT Unfortunately, infrastructural investment in many South African rural areas is not a priority. Factors such as poor municipalities and mismanagement of funds lead to rural areas receiving very limited infrastructural investment. With insufficient investment, there is a decline in the economic conditions in many rural areas. The negative economic conditions play a significant role in driving rural-urban migration which leads to rural depopulation. One of the most pressing challenges facing South African rural communities is the deplorable (terrible) condition of roads as only 10% of roads in the Eastern Cape are paved. The inadequate road networks hinder access to essential services like healthcare and education and impede economic development by limiting the transportation of goods and access to markets. Developing infrastructure could catalyse (drive) a virtual cycle in which private sector increases investment, in turn leading to increased economic opportunities in rural areas [Adapted from www.ufh.ac.za/news/News/NeglectedRuralInfrastructureCriticalOversightSA] |
3.3.1 From the extract, name ONE factor that contributes to limited infrastructural investment in rural areas. (1 x 1) (1)
3.3.2 How does rural-urban migration give rise to rural depopulation? (1 x 2) (2)
3.3.3 Why does rural depopulation negatively affect the economies of rural settlements? (2 x 2) (4)
3.3.4 In a paragraph of approximately EIGHT lines, explain how developing infrastructure in rural areas could help reduce the impacts of rural depopulation. (4 x 2) (8)
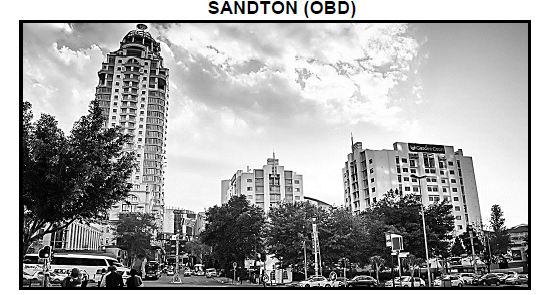
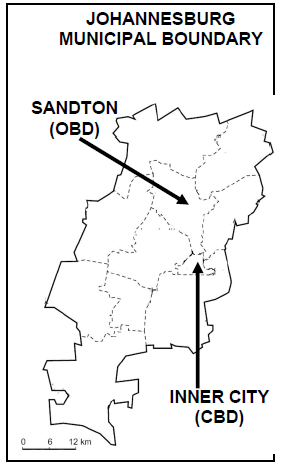
3.4 Refer to the infographic on the central business district (CBD) of Johannesburg as a land-use zone.
THE DECLINE OF THE JOBURG CBD The Johannesburg CBD was a bustling economic hub (concentration) of business, retail and commerce. However, over the years, this land-use zone has lost its appeal. One of the most evident signs of the CBD’s decline is the migration of businesses and high-end retailers to Sandton. This shift is mostly due to the high levels of street crimes in the inner city. The safety issues have ultimately left the CBD bereft (deprived) of the economic activity that once defined it. A number of various initiatives have been launched by city officials to rejuvenate the CBD. From urban renewal projects to stricter law enforcement campaigns, there have been concerted efforts to reclaim the CBD’s prestige (high status). Unfortunately, these efforts have not brought about the desired changes.
|
 |
3.4.1 What is an urban land-use zone? (1 x 2) (2)
3.4.2 State TWO factors that would have originally attracted the high concentration of business to the CBD. (2 x 1) (2)
3.4.3 According to the extract, what is the main reason for businesses moving out of the CBD? (1 x 1) (1)
3.4.4 What attracts (pulls) businesses to outlying business districts (OBD) such as Sandton? (2 x 2) (4)
3.4.5 Explain the positive economic impact that reclaiming the prestige (high status) of the CBD would have on cities like Johannesburg. (3 x 2) (6) [40]
TOTAL SECTION A: 120
SECTION B
QUESTION 4: GEOGRAPHICAL SKILLS AND TECHNIQUES
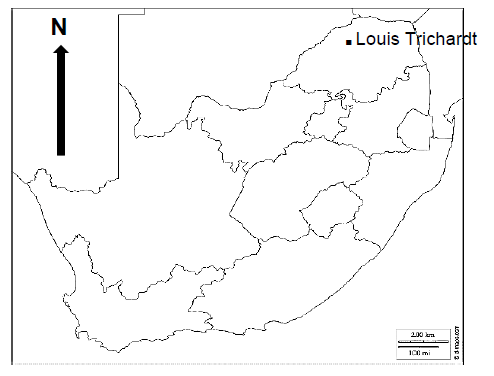
| GENERAL INFORMATION ON LOUIS TRICHARDT Coordinates: 23° 3′ 0″ S; 29° 54′ 0″ E Located in the Limpopo Province in South Africa, Louis Trichardt is a town at the foot of Songozwi, in the Soutpansberg mountain range. It is the centre of the Makhado Local Municipality and is located in a fertile region. Louis Trichardt has a subtropical climate where litchis, bananas, mangoes and nuts are produced. Most of Louis Trichardt's economy is boosted by farming activities around the town. The town's economy might experience a further boost if proposed mines open in the area. There has, however, been a lot of resistance from nature conservationists against mines opening in the area. [Adapted from https://en.wikipedia.org/wiki/Louis_Trichardt] |
The following English terms and their translations are shown on the topographic map:
| ENGLISH | AFRIKAAN |
Aerodrome Canal Diggings Furrow Golf course Sewerage works Show grounds Waterfall Weir | Vliegveld Kanaal Uitgrawings Voor Gholfbaan Rioolwerke Skougronde Waterval Studam |
MAP SKILLS AND CALCULATIONS
4.1 Various options are provided as possible answers to QUESTIONS 4.1.1 and 4.1.2. Choose the correct answer and write only the letter (A–D) next to the question numbers (4.1.1 to 4.1.2) in the ANSWER BOOK, for example 4.1.3 D.
4.1.1 In which province is Louis Trichardt located?
A Mpumalanga
B Gauteng
C Free State
D Limpopo (1 x 1) (1)
4.1.2 On the topographical map, the feature found at 23ْ02‘39‘‘S and :E’’11’54ْ29
A Hotel
B School
C Place of Worship
D Store (1 x 1) (1)
4.1.3 (a) What feature does line 5 to 6 on the orthophoto map represent: a valley or a spur? (1 x 1) (1)
(b) Why is there intervisibility between 5 and 6? (1 x 1) (1)
4.1.4 (a) Calculate the straight-line distance in metres (m) from spot height 988 (E2) to spot height 993 (D1) on the orthophoto map. (2 x 1) (2)
(b) Using your answer from QUESTION 4.1.4 (a) calculate the average gradient from spot height 988 (E2) to spot height 993 (D1) on the orthophoto map.
Use the formula: Gradient = Vertical Interval (VI)
Horizontal Equivalent (HE) (3 x 1) (3)
(c) How has the gentle average gradient calculated in QUESTION 4.1.4 (b) influenced human activity in the area between the spot heights? (1 x 1) (1)
4.2 MAP INTERPRETATION
Refer to O on the topographical map and the image below which shows a photograph of the O.
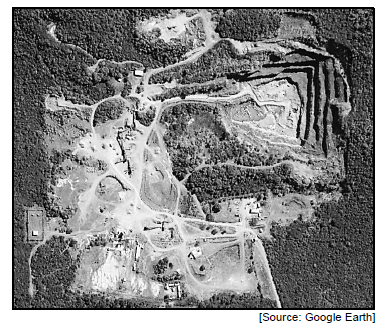
[Source: Google Earth]
4.2.1 (a) The angle of the aerial photograph is (vertical or oblique): (1 x 1) (1)
(b) What feature does O represent? (1 x 1) (1)
(c) Why can O be considered an environmental injustice? (2 x 1) (2)
Refer to the street plan (R) on the topographical map.
4.2.2 What evidence suggests that the street plan at R is grid iron? (1 x 1) (1)
4.2.3 Why does a grid iron street plan hinder the flow of traffic? (1 x 2) (2) Refer to N in block C1 and S in block B1.
4.2.4 Which settlement, N or S, is classified as a nucleated rural settlement developed in a linear pattern? (1 x 1) (1)
4.2.5 Explain your answer to QUESTION 4.2.4. (2 x 1) (2)
Refer to M in block C2.
4.2.6 State TWO advantages of this isolated (dispersed) farmstead. (2 x 1) (2)
4.3 GEOGRAPHY INFORMATION SYSTEMS (GIS)
4.3.1 Higher resolution of an image is determined by:
(i) Many pixels
(ii) Few pixels
(iii) Small pixels
(iv) Large pixels
A (ii) and (iii)
B (i) and (iv)
C (ii) and (iv)
D (i) and (iii) (1 x 1) (1)
Refer to block D2 on the topographical map.
4.3.2 Define the concept attribute data. (1 x 2) (2)
4.3.3 Give ONE attribute that influenced the location of the Louis Trichardt Aerodrome (K) in block D2 on the topographical map. (1 x 2) (2)
Refer to block E1 on the topographical map.
4.3.4 Suggest ONE data layer that the farmer considered before establishing his farm in this specific area (block E1). (1 x 1) (1)
4.3.5 Provide a reason for the choice of data layer in QUESTION 4.3.4. (1 x 2) (2) [30]