GRADE 12 MATHEMATICAL LITERACY PAPER 2 QUESTIONS - NSC PAST PAPERS AND MEMOS NOVEMBER 2016
Share via Whatsapp Join our WhatsApp Group Join our Telegram GroupGRADE 12 MATHEMATICAL LITERACY
PAPER TWO (P2)
NSC EXAM PAPERS AND MEMOS
NOVEMBER 2016
INSTRUCTIONS AND INFORMATION
- This question paper consists of FOUR questions. Answer ALL the questions.
- Use the ADDENDUM with ANNEXURES to answer the following questions:
ANNEXURE A for QUESTION 2.1
ANNEXURE B for QUESTION 2.2
ANNEXURE C for QUESTION 3.2
ANNEXURE D for QUESTION 4.2 - Number the answers correctly according to the numbering system used in this question paper.
- Start EACH question on a NEW page.
- You may use an approved calculator (non-programmable and non-graphical), unless stated otherwise.
- Show ALL calculations clearly.
- Round off ALL final answers appropriately according to the given context, unless stated otherwise.
- Indicate units of measurement, where applicable.
- Maps and diagrams are NOT drawn to scale, unless stated otherwise.
- Write neatly and legibly.
QUESTIONS
QUESTION 1
1.1
A company installed computers at a computer centre in October 2015. The manager used a bank account to pay the employees' wages for the project.
| |||||||||||||||||||||||||||||||||||||||||||||||||||||||||||||
Use TABLE 1 and the calendar above to answer the following questions.
1.1.1 Determine the probability of randomly selecting a workday in October 2015 with a date that is an even number. (3)
1.1.2 Give ONE valid reason why a company will not necessarily use a bank offering the lowest bank charges. (2)
1.1.3 Determine the missing value of A (rounded off to ONE decimal place) if the 2014 withdrawal fee was equal to:
(R3,50 + 1,1% of the withdrawal amount)
You may use the following formula:
Percentage change in fees = [ 2015 fee per R1 000 - 1] × 100%
2014 fee per R1 000
1.1.4 The company withdrew R15 000 for the weekly wages every Friday. The financial officer stated that the company would have saved more than R90 in withdrawal fees if they had used Bank Y rather than Bank X for the four withdrawals.
Verify whether this statement is valid. (7)
1.1.5 Calculate an employee's total monthly wage if he earned R2 142,85 per week in October 2015. Assume that the employee was not absent and did not work overtime in this month. (4)
1.2
| Since 2012 there has been a decrease in the number of computers shipped globally. TABLE 2 below shows the changes in the number of computers shipped globally by the five largest computer manufacturers worldwide in the first quarter of 2012 and the first quarter of 2013. TABLE 2: GLOBAL SHIPMENT OF COMPUTERS BY THE FIVE LARGEST COMPUTER MANUFACTURERS
| ||||||||||||||||||||
Use the information in TABLE 2 above to answer the following questions.
1.2.1 Give and explain TWO possible factors that could have led to the decrease in the global shipment of computers since 2012. (4)
1.2.2 Determine the difference between the total number of computers shipped globally by the five manufacturers in the first quarter of 2012 and the first quarter of 2013. (4)
1.2.3 It was stated that in this period, manufacturer A showed a greater percentage decrease in the shipment of computers compared with manufacturer D.
Verify (showing ALL calculations, whether this statement is valid. (7)
[36]
QUESTION 2
2.1
A representative of the Department of Tourism gave an overview of the spending by all tourists (domestic and international) in 2013. |
Use the information above and ANNEXURE A to answer the following questions.
2.1.1
(a) Calculate the total amount spent by all tourists in 2012. (3)
(b) Explain whether it is more appropriate to round off the rand value of the total amount spent in billions to one decimal place, rather than rounding off the rand value of the total amount spent in billions to the nearest whole number. (3)
2.1.2 The average amount spent by international tourists in 2013 was exactly R6 580. Verify, showing ALL calculations, whether this amount is CORRECT. (6)
2.1.3 Identify the item(s) on which international tourists spent the least money. (2)
2.1.4 Give ONE suitable example of a 'tourism-related item'. (2)
2.1.5 The tourism industry's direct contribution to the gross domestic product (GDP) was R103,6 billion in 2013.
The tourism industry's annual contribution to the GDP remained constant at an annual compound interest rate of 2,9% for the next three years.
Determine the total amount (rounded off to the nearest million) that the tourism industry contributed to the GDP in 2016. (6)
2.2
Tourists can travel by train as one of the modes of transport in South Africa. |
Use ANNEXURE B to answer the following questions.
2.2.1
- Calculate the total stopover time at all the railway stations between Johannesburg and East London. (5)
- Hence, determine the modal stopover time at the railway stations. (2)
- Determine the average speed at which the train travelled from Johannesburg to East London.
You may use the following formula:
D=SXT
where
D = distance (in km)
S = average speed (in km/h)
T = time in hours (h), excluding stopover times at railway stations (7)
2.2.2 Calculate the total cost of the return train trip for the family. (11)
[47]
QUESTION 3
3.1
Simone uses the local swimming pool to give swimming lessons.
|
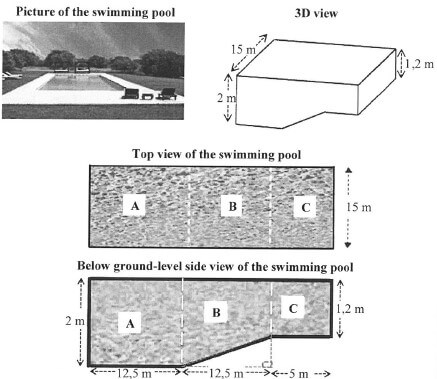
3.1.1 Show, with calculations, that the maximum capacity of the swimming pool is 765 m3. (5)
3.1.2 Calculate the volume of water (in gallons) required to fill the swimming pool to 94% of its capacity. (4)
3.1.3 The pool must be topped up with 135 000 l of water due to water loss. The pool is filled with water at a constant rate of 2 350 litres per hour. Simone says that it will take exactly 2½ days to top up the pool. Verify, showing ALL calculations, if her statement is valid. (5)
3.2
Swimming lessons are offered four times a week to three different groups. |
Use ANNEXURE C to answer the following questions.
3.2.1 Determine missing value x if the mean attendance for M is 15. (4)
3.2.2 Determine the interquartile range for A. (4)
3.2.3 Give a possible reason why E has full attendance on more days than M. (2)
3.2.4 Determine the probability (expressed as a whole percentage) of randomly choosing a day on which A has full attendance. (3)
3.2.5 Give TWO reasons why the attendance of A is considered to be better than that of M by using the box and whisker plots. (4)
[31]
QUESTION 4
4.1
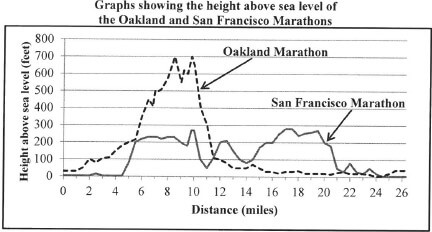
In 2015 Keitumetse participated in the Oakland Marathon and the San Francisco Marathon. NOTE:
|
Use the graphs above to answer the following questions.
4.1.1 Show by calculation that one mile is equivalent to 1 760 yards. (2)
4.1.2 Determine the approximate distance (in miles) from the start of the San Francisco Marathon to where the height above sea level rises steeply for the first time. (2)
4.1.3 Calculate the maximum height above sea level (in metres) for the Oakland Marathon. (3)
4.1.4 An Oakland Marathon participant stated that the first 10 miles had been the most difficult, but thereafter it was much easier. Give a possible reason for this participant's statement. (2)
4.2
| Keitumetse also visited the Denver Zoo during his stay in America. The layout plan of the zoo, showing some animal enclosures and a map of the surrounding area, is given in ANNEXURE D. |
Use ANNEXURE D to answer the following questions.
4.2.1 Determine the total number of venues that are available for services and education. (2)
4.2.2 Keitumetse entered the zoo, passed the predator enclosure and continued walking in a westerly direction. Name the next major animal enclosure that he will encounter. (2)
4.2.3 If the area of the elephant enclosure is approximately the size of the area of four football fields, estimate the area of the entire zoo in terms of the area of football fields. (4)
4.2.4 The shortest distance between York Street and Colorado Street is 1,6 km. Verify (showing ALL calculations) whether the bar scale on the map is correct. (7)
4.3
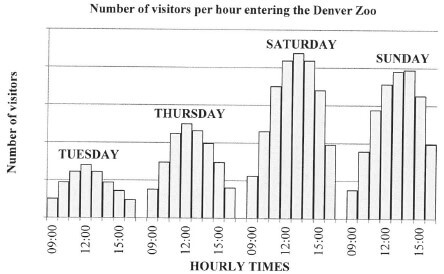
The bar graphs below show the number of visitors per hour entering the Denver Zoo on four days of the week. [Adapted from Wikipedia/Denver Zoo] |
Use the graph above to answer the following questions.
4.3.1 According to the graph, on which day do most people visit the zoo? (2)
4.3.2 Give ONE reason why it cannot be said with certainty that 12:00 on a Monday is NOT a very popular time for visitors to enter the zoo. (2)
4.3.3 Describe TWO possible trends that relate to the number of visitors and the hourly times visitors enter the zoo.(4)
4.3.4 Keitumetse states that at 09:00 on Saturdays the number of visitors entering the gates is nearly double the number of visitors at 09:00 on Tuesdays.
Give TWO reasons to justify this statement. (4)
[36]
TOTAL: 150