GRADE 12 MATHEMATICS LITERACY PAPER 2 QUESTIONS - NSC PAST PAPERS AND MEMOS FEBRUARY/MARCH 2017
Share via Whatsapp Join our WhatsApp Group Join our Telegram GroupGRADE 12 MATHEMATICS LITERACY
PAPER 2
NSC PAST PAPERS AND MEMOS
FEBRUARY/MARCH 2017
INSTRUCTIONS AND INFORMATION
- This question paper consists of FOUR questions. Answer ALL the questions.
-
2.1 Answer QUESTIONS 3.1.3 and 3.1.4 on the attached ANSWER SHEET.
2.2 Write your centre number and examination number in the spaces on the ANSWER SHEET. Hand in the ANSWER SHEET with your ANSWER BOOK.
2.3 Use the ANNEXURES in the ADDENDUM to answer the following questions:
ANNEXURE A for QUESTION 2.1
ANNEXURE B for QUESTION 2.2
ANNEXURE C for QUESTION 4.1
ANNEXURE D for QUESTION 4.2 - Number the answers correctly according to the numbering system used in this question paper.
- Start EACH question on a NEW page.
- You may use an approved calculator (non-programmable and non-graphical), unless stated otherwise.
- Show ALL calculations clearly.
- Round off ALL final answers appropriately according to the given context, unless stated otherwise.
- Indicate units of measurement, where applicable.
- Maps and diagrams are NOT necessarily drawn to scale, unless stated otherwise.
- Write neatly and legibly.
QUESTIONS
QUESTION 1
1.1
The recent worldwide displacement of people hit an all-time high because of increases in wars and persecutions.
The data below, released by the United Nations' refugee agency (UNHCR), shows the numbers and percentages of the three categories of displaced people for 2016. |
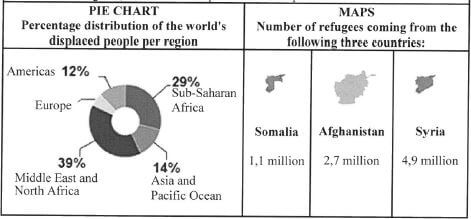
Some of the forcibly displaced people and refugees are given temporary residence in various world regions, as shown in the pie chart and maps below. 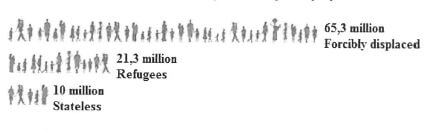 |
 |
[Adapted from UNHCR, 20 June 2016]
Use the information above to answer the questions that follow.
1.1.1 Estimate (to the nearest hundred million) the world population in 2016, given that one in every 113 people is forcibly displaced. (3)
1.1.2 Determine the total number of displaced people that are distributed in Europe.
1.1.3 A spokesperson of the UNHCR stated that 54% of all refugees worldwide come from Somalia, Afghanistan and Syria.
Verify (showing ALL calculations) whether this statement is valid. (5)
1.2
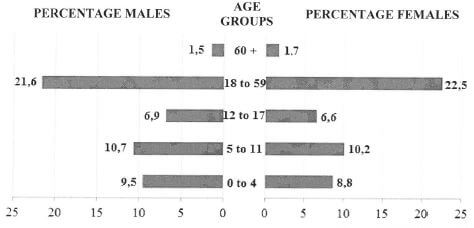
The bar graphs below show the percentages of refugees according to age and gender, entering Europe.
[Source: UNHCR, 20 June 2016] |
Use the bar graphs above to answer the questions that follow.
1.2.1 Determine the probability (as a percentage) of randomly selecting a female refugee younger than 18 years from the refugees who entered Europe. (3)
1.2.2 Give a possible reason why the percentage of refugees in the age group 18 to 59 will always be the largest. (2)
1.3
TABLE 1 below shows the number of refugees entering Europe by sea during the first six months of 2014 and 2015.
Source: UNHCR, 20 June 2016] | ||||||||||||||||||||||||||||
Use the data above to answer the questions that follow.
1.3.1 State which month showed the greatest increase in the number of refugees from 2014 to 2015. (2)
1.3.2 Determine the average monthly number of refugees entering Europe during the first six months of 2015. (3)
1.3.3 Describe a possible trend based on the data in TABLE 1.
1.4 The UNHCR was launched on an annual budget of US$300 000 in 1950. The annual budget reached a new high of US$ 5 300 million in 2013. The budgeted amount for 2016 is expected to be 18,7% higher than the budget for 2013.
Determine the factor value by which the annual budget increased from 1950 to 2016. (5)
[31]
QUESTION 2
2.1
| The Wimbledon tennis championships are held in London annually. Wimbledon has a total of 41 grass courts consisting of 19 match courts and 22 practice courts. TABLE 2 below shows some interesting facts about Wimbledon.
[Source: www.wimbledon.com/en GB/atoz/faq_and facts and figures] A ground plan of Wimbledon is shown in ANNEXURE A. | ||||||||||||||||
Use the information above and the ground plan in ANNEXURE A to answer the questions that follow.
2.1.1 Calculate the maximum density (to the nearest unit) of the spectators at the Wimbledon grounds. (3)
You may use the following formula:
Density of spectators = Number of spectators
Ground size (in acres)
2.1.2 If all the grounds are filled to capacity, determine the probability (rounded off to TWO decimal places) of randomly selecting a spectator from No. 1 Court. (3)
2.1.3 Give a possible reason why the number of seats and the maximum number of spectators at Centre Court are different. (2)
2.1.4 Explain which numbered match court has the highest probability of being affected by traffic noise. (3)
2.1.5 The general direction from the centre of No. 3 Court to a player at position A on No. 1 Court is directly north.
In which general direction is the position of the large TV screen in relation to the player at A? (2)
2.1.6 The height of the large, rectangular TV screen is 5 m.
Determine, showing ALL calculations, the scale of the map in the form 1 : ... (5)
2.2
| The seating plan of No. 3 Court at Wimbledon is shown in ANNEXURE B. The rows are labelled using the letters of the alphabet. |
Use the seating plan to answer the questions that follow.
2.2.1 Determine with which letter the front row on the north side of No. 3 Court should be labelled. (2)
2.2.2 Name the aisles that would be closest to a person seated in the south-westerly corner of the court. (2)
2.2.3 Give ONE valid reason why aisle 10 should have the least spectators using the aisle. (2)
2.2.4 An area of 41 m x 22 m of No. 3 Court is covered with grass. The two types of grass used are in the ratio rye : fescue = 7:3
The groundsman stated that he requires 65 kg fescue seed for No. 3 Court if 245 g of grass seed are sown per square metre.
Verify whether his statement is valid.
You may use the following formula:
Area of a rectangle = length x width
2.3
One of the most popular foodstuffs sold at Wimbledon is strawberries and cream. Selling price of a portion of strawberries and cream from 1993 to 2014 |
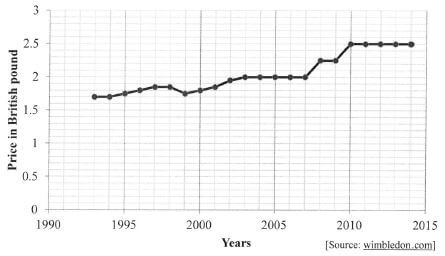
Use the graph and information above to answer the questions that follow.
2.3.1 Calculate the average ANNUAL percentage increase of the selling price of strawberries and cream from 1993 to 2014. (5)
You may use the following formula
Percentage increase = Difference in selling price x 100 %
Initial selling price
2.3.2 Determine the total income from the sale of 142 000 portions of strawberries and cream in 2012. (3)
2.3.3 The selling price of strawberries and cream is determined by the annual inflation rate. Comment on the annual inflation rates from 2010 to 2014. (2)
[40]
QUESTION 3
3.1
Jumanda decided to investigate the temperature changes in Upington by using the historical data of the recorded temperatures. The historical records of extreme maximum and minimum temperatures as well as mean maximum and minimum temperatures (in degrees Celsius) of Upington are given in TABLE 3 below.
[Source: myweather2.com » Local Weather Forecast > South Africa > Upington] | ||||||||||||||||||||||||||||||||||||||||||||||||||||||||||||||||||||||||||
Use TABLE 3 and the ANSWER SHEET to answer the questions that follow.
3.1.1 Determine the difference between the extreme maximum and extreme minimum temperatures for May. (2)
3.1.2 Determine, showing ALL calculations, in which month the range of the mean temperatures in Upington was the greatest. (3)
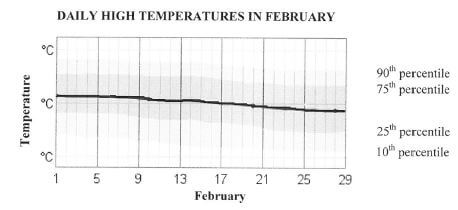
3.1.3 The graphs showing the extreme maximum temperatures and mean maximum and minimum temperatures are drawn on the ANSWER SHEET.
Draw another line graph representing the extreme minimum temperatures of Upington on the grid on the ANSWER SHEET.
3.1.4 The line graph showing the average daily maximum temperature with percentile bands is also drawn on the ANSWER SHEET. The inner band is from the 25th to the 75 percentile and the two outer bands are from the 10th to the 25th and the 75th to the 90th percentile.
In which percentile band will the temperature of 36 ºC recorded on 18 February 2016 be classified? (2)
3.1.5 According to Eco Watch the highest temperature for October was recorded on Tuesday 27 October 2015 in Vredendal, when the temperature reached 119,1ºF.
Convert this temperature to ºC (rounded off to ONE decimal place), using the following formula: (4)
ºF = ºC × 9 + 32
5
3.2
Jumanda also studied the wind directions in Upington. The bar graph below shows the annual percentage wind direction occurrences. Annual percentage wind direction occurrences in Upington [Source: weatherspark.com/averages) NOTE: The wind direction is undefined when there is no wind. |
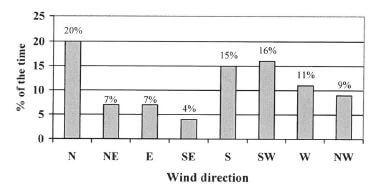
Use the bar graph above to answer the questions that follow.
3.2.1 Determine the modal wind direction. (2)
3.2.2 Determine the probability that on any given day the wind direction will be from any westerly direction. (2)
3.2.3 Explain why a pie chart cannot easily be used to represent this data. (2)
3.3
Jumanda's three friends from Angola will visit him in Upington. They plan to stay at a resort that charges R850 per unit per day for accommodation.
[Source: Coinmill.com, 2 June 2016] |
Use the information above to answer the questions that follow.
3.3.1 Determine (in Kz) the equal amount that EACH of the friends must contribute towards the accommodation per day. (5)
3.3.2 The average monthly disposable salary (AMDS) in Angola is $1 760,41 and in South Africa it is R16 500.
The average monthly rental cost for an apartment in Angola is Kz145 990, whereas a similar apartment in South Africa costs R4 430 per month.
One of the friends stated, 'The average rental cost of an apartment in Angola, expressed as a percentage of the AMDS, is double the percentage of a similar apartment in South Africa.'
Verify, showing ALL calculations, whether this statement is valid. (7)
[36]
QUESTION 4
4.1
Packages are usually delivered by courier services. The courier cost is dependent on the space that a package occupies rather than the mass of the package. This measure is called the volumetric mass and is calculated by using the following formula and TABLE 5 below:
[Source: www.globeflight.co.za/index.php/couriergadgets/ ] You may use the following formulae:
Boxes with the given dimensions are shown in ANNEXURE C. | ||||||||
Use the information above and ANNEXURE C to answer the questions that follow.
4.1.1 Calculate the volumetric mass of a box of size Y if it has to be delivered the next day.
4.1.2 Determine, showing ALL calculations, which mass factor the company used for the box of size X if the volumetric mass of the box is approximately 2 kg. (5)
4.1.3 The company uses boxes of size Z to transport substances with a volumetric mass of 25 kg. These boxes are wrapped using special wrapping paper.
A client commented that the total surface area of the square-based box is less than the total surface area of a rectangular-based box.
Verify whether this comment is valid. (7)
4.2
| A courier company that operates from Mbombela uses maps and pricing schedules, as indicated in ANNEXURE D, to show the cost of their services. |
Use the information in ANNEXURE D to answer the questions that follow.
4.2.1 Give a possible reason why certain places on the map are marked for a 48-hour delivery service. (2)
4.2.2 A shop in Mbombela sends three identical 18 kg parcels to be delivered in Graskop, Klerksdorp and Port Alfred.
NOTE: Port Alfred is in the shaded (grey) area.
- Determine the total delivery cost, including 14% VAT, for the three packages. (10)
- The courier picked up the parcels at 14:50 on 30 April and delivered one parcel in Port Alfred at 08:15 on 2 May.
Verify whether this delivery was done within the specified service delivery time.
4.2.3 A factory in Mbombela needs to send 650 parts with mass of 2 kg each to George.
They can pack the parts in the following two box sizes:
- Box size A (to pack 7 parts)
- Box size B (to pack 15 parts)
- Determine the total delivery cost, excluding VAT, for using only box size A to send all the parts. (4)
- Hence, showing further calculations, advise the management on which ONE of the two options is more economical for the factory. (7)
[43]
TOTAL: 150
ANSWER SHEET
CENTRE NUMBER:
EXAMINATION NUMBER:
QUESTION 3.1.3 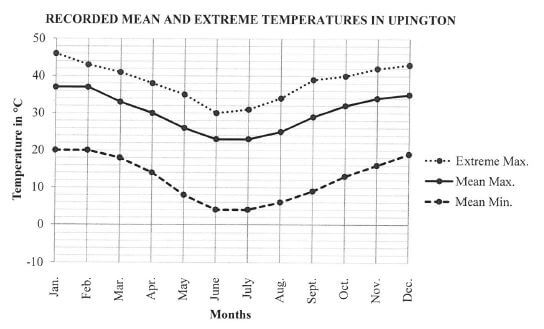
QUESTION 3.1.4