LIFE SCIENCES GRADE 12 PAPER 2 QUESTIONS - NSC PAST PAPERS AND MEMOS SEPTEMBER 2017
Share via Whatsapp Join our WhatsApp Group Join our Telegram GroupLIFE SCIENCES
GRADE 12
PAPER 2
NSC PAST PAPERS AND MEMOS
SEPTEMBER 2017
INSTRUCTIONS AND INFORMATION
Read the following instructions carefully before answering the questions.
- Answer ALL the questions.
- Write ALL the answers in the ANSWER BOOK.
- Start the answer to EACH question at the top of a NEW page.
- Number the answers correctly according to the numbering system used in this question paper.
- Present your answers according to the instructions of each question.
- ALL drawings MUST be done in pencil and labelled in blue or black ink.
- Draw diagrams, flow charts or tables ONLY when asked to do so.
- The diagrams in this question paper are NOT necessarily drawn to scale.
- Do NOT use graph paper.
- You must use non-programmable calculator, protractor and a compass, where necessary.
- Write neatly and legibly.
QUESTIONS
SECTION A
QUESTION 1
1.1 Various options are provided as possible answers to the following questions. Choose the correct answer and write only the letter (A–D) next to the question number (1.1.1–1.1.10) in the ANSWER BOOK, for example 1.1.11 D.
1.1.1 During which phase of meiosis do homologous chromosome pairs separate?
- Metaphase I
- Anaphase I
- Anaphase II
- Telophase II
1.1.2 A codon is a sequence of three nucleotides on a molecule of …
- rRNA.
- mRNA.
- tRNA.
- DNA.
1.1.3 Which of the following distinguishes prophase 1 of meiosis from prophase of mitosis?
- Homologous chromosomes pair up
- Spindle forms
- Nuclear membrane breaks down
- Chromosomes become visible
1.1.4 Scientists recovered the body of a woolly mammoth from the frozen soil of Siberia. The DNA sequence of the woolly mammoth was very similar to the DNA sequence of the African elephant. Which of the following is a conclusion for this data?
- The woolly mammoth and African elephant have a common ancestor
- The woolly mammoth is not related to the African elephant
- The woolly mammoth has the same number of chromosomes as the African elephant
- The woolly mammoth and the African elephant should be classified as the same species
1.1.5 DNA was analysed and found to contain 14% T (thymine). What percentage of the molecule is cytosine?
- 14%
- 28%
- 36%
- 72%
1.1.6 Which one of the following statements is a correct description of a hypothesis and a theory?
- An accepted theory becomes a hypothesis
- An accepted hypothesis becomes a theory
- Hypotheses and theories are different names for the same concept
- Theories can be tested experimentally, whereas hypotheses cannot
1.1.7 An extra finger in humans is rare, but is due to a dominant gene. When one parent is normal and the other parent has an extra finger but is homozygous for the trait, what is the chance that their children will be normal?
- 0%
- 25%
- 50%
- 75%
1.1.8 Which ONE of the following correctly describes the ploidy and number of cells produced at the end of meiosis?
PLOIDY | NUMBER OF CELLS | |
A | haploid | two |
B | haploid | four |
C | diploid | two |
D | diploid | four |
1.1.9 Scientists visiting a group of four islands P, Q, R and S found similar spiders on each island. They carried out investigations to see if the spiders from the different islands belonged to the same species.
The results are in the table below (✔ indicates successful interbreeding. X indicates unsuccessful interbreeding)
| Spiders from | ||||
| P | Q | R | S | |
P | ✔ | ✔ | X | X |
Q | ✔ | ✔ | X | X |
R | X | X | ✔ | X |
S | X | X | X | ✔ |
Which two populations belong to the same species?
- Q and R
- R and S
- Q and S
- P and Q
1.1.10 A gene in a bacterium codes for a protein that has 120 amino acids. How many mRNA nucleotides code for this protein?
- 30
- 40
- 360
- 480 (10 x 2) (20)
1.2 Give the correct BIOLOGICAL TERM for each of the following descriptions. Write only the term next to the question number (1.2.1–1.2.10) in the ANSWER BOOK.
1.2.1 The analysis of DNA samples to identify individuals or relationships between individuals
1.2.2 The nitrogenous base found in RNA but not in DNA
1.2.3 The division of the cytoplasm after a cell nucleus has divided
1.2.4 The organelle where protein synthesis occurs
1.2.5 A sugar that is a component of DNA
1.2.6 The preserved remains of ancient organisms
1.2.7 The different forms of a gene
1.2.8 The death of the last individual of a species
1.2.9 Having a face with protruding jaws
1.2.10 Position of a gene on a chromosome (10 x 1) (10)
1.3 Indicate whether each of the descriptions in COLUMN I applies to A ONLY, B ONLY, BOTH A AND B or NONE of the items in COLUMN II. Write A only, B only, both A and B or none next to the question number (1.3.1–1.3.3) in the ANSWER BOOK.
COLUMN I | COLUMN II |
1.3.1 Evidence of evolution |
|
1.3.2 Identical alleles for a trait |
|
1.3.3 Discovery of DNA |
|
(3 x 2) (6)
1.4 The table below shows some events which take place during protein synthesis.
A | tRNA molecules bring specific amino acids to the mRNA molecule |
B | mRNA nucleotides join with exposed DNA bases and form a molecule of mRNA |
C | The two strands of a DNA molecule separate |
D | Peptide bonds form between the amino acids |
E | The mRNA molecule leaves the nucleus |
F | A ribosome attaches to the mRNA molecule |
1.4.1 Write the letters to show the correct sequence of these events. (2)
1.4.2 In which structure of the cell does process C take place? (1)
1.4.3 Give the letters (A–F) only of those events that are associated with translation. (3)
1.4.4 The table below shows some mRNA codons and the amino acids for which they code.
mRNA codon | Amino acid |
GUU | Valine |
CUU | Leucine |
GCC | Alanine |
AUC | Isoleucine |
GAA | Glutamic acid |
ACC | Threonine |
Give the DNA base sequence that codes for threonine. (1)
1.4.5 A tRNA molecule has the anticodon GAA. Which amino acid does the tRNA molecule carry? (1)
1.5 Mice may have white fur or black fur. The diagram shows the inheritance of fur colour in mice. 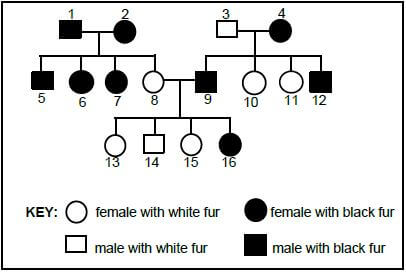
1.5.1 What is this diagram called? (1)
1.5.2 How many sets of parents are represented in this diagram? (1)
1.5.3 Give the phenotype:
- Which is dominant (1)
- Of individual 9 (1)
1.5.4 Use the letter A for the dominant allele and a for the recessive allele to give the genotype of:
- 8 (1)
- 16 (1)
TOTAL SECTION A: 50
SECTION B
QUESTION 2
2.1 The diagram below is a representation of the chromosomes in a human cell.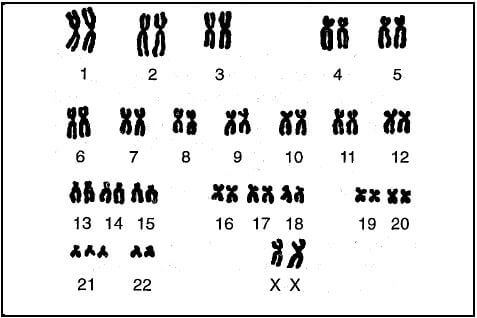
2.1.1 How many autosomes are in this cell? (1)
2.1.2 This individual is a female. Explain why this conclusion is made. (1)
2.1.3 What evidence is there to show that this individual has a genetic disorder? (1)
2.1.4 Identify the genetic disorder mentioned in QUESTION 2.1.3. (1)
2.1.5 Name the process that resulted in this genetic disorder. (1)
2.2 Describe the process whereby a copy of a DNA molecule is made. (7)
2.3 Humans have different blood groups which are coded for by a number of alleles.
Mary has the genotype IAi and her son Joseph has blood type AB.
2.3.1 How many alleles code for blood groups? (1)
2.3.2 Give:
- Mary’s blood group (1)
- Joseph’s genotype (1)
- All the possible genotypes of Joseph’s father (3)
2.4 In cats the allele for short hair is dominant (H) to the allele for long hair (h).
A short-haired cat that is heterozygous is crossed with a long-haired cat. Use a genetic cross to determine the percentage chance of the offspring being heterozygous for hair length. (6)
2.5 The European Corn Borer (ECB) worm is a pest which reduces crop yield of corn on farms. The soil bacterium Bacillus thuringiensis (Bt) contains a gene which causes the production of a poison which kills the ECB worm.
In an effort to control the ECB worm, scientists incorporated the Bt poison gene into a corn plant resulting in corn plants that produce the same poison.
They wanted to investigate if using the Bt corn would increase crop yields.
The scientists conducted the investigation as follows:
- They planted Bt corn in one field and non Bt corn in another field (the environmental conditions for the two fields were exactly the same)
- The European Corn Borer was introduced into the fields
- The plants were grown and harvested after a period of five months
- The average yield of plants was recorded
- The experiment was repeated four times and an average was calculated. The results are shown in the table below.
TABLE SHOWING THE AVERAGE YIELD OF DIFFERENT VARIETIES OF CORN PLANTS
Average crop yield (bushels per acre) | |
Corn variety | With ECB |
non Bt | 146 |
Bt corn | 158 |
2.5.1 Name the process by which the Bt gene is inserted into corn to make Bt corn. (1)
2.5.2 State the hypothesis of this investigation. (2)
2.5.3 State the:
- Independent variable (1)
- Dependent variable (1)
2.5.4 Describe ONE way in which the reliability was ensured in this investigation. (1)
2.5.5 State the conclusion for this investigation. (2)
2.5.6 Explain ONE benefit to a farmer of using Bt corn. (2)
2.5.7 On the same set of axes, draw a bar graph to show the average crop yield of the two varieties of corn plants. (6)
[40]
QUESTION 3
3.1 Use the diagrams below of a cell process to answer the following questions.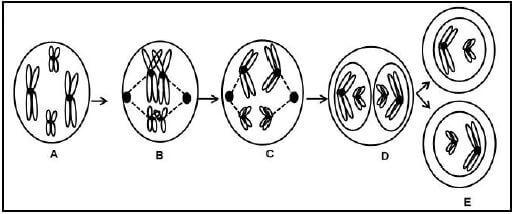
3.1.1 Name the process represented by the diagrams above. (1)
3.1.2 Give TWO reasons for your answer in QUESTION 3.1.1. (2)
3.1.3 Identify the phases labelled C and D. (2)
3.2 A population of insects was treated with an insecticide from the year 1995 to 1998. The percentage that were resistant to the insecticide was calculated.
The table below shows data from an insect population in 1995 and 1998.
| CHANGE IN AN INSECT POPULATION'S RESISTANCE TO INSECTICIDE | ||
Characteristic | Percent of population in 1995 | Percent of population in 1998 |
resistant | 0,15 | 99,1 |
not resistant | 99,85 | 0,9 |
3.2.1 Describe the changes in the insect population between 1995 and 1998. (3)
3.2.2 Describe how natural selection caused insecticide resistance in this population. (6)
3.3 The diagram below shows an evolutionary process taking place in a population of salamanders in California. The process took place gradually, millions of years ago. Study the diagram and answer the questions that follow. 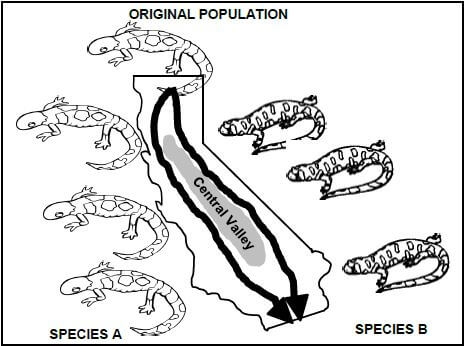
3.3.1 What evolutionary process is illustrated in the diagram above? (1)
3.3.2 Use the diagram to explain how the Species B evolved from the original population. (6)
3.3.3 Explain why this is not an example of punctuated equilibrium. (3)
3.4 The following diagrams show the pelvis and skulls of three organisms, Australopithecus, a gorilla and a modern human in no particular order. 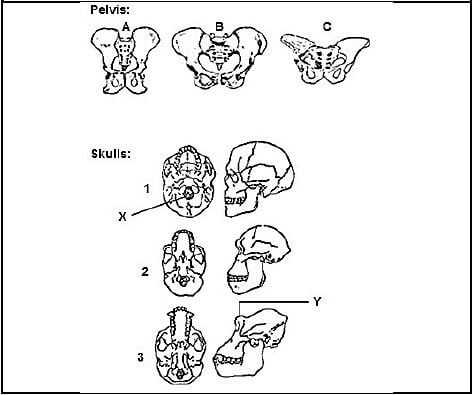
3.4.1 Give the number only of the skull belonging to the pelvis:
- A (1)
- B (1)
- C (1)
3.4.2 Give the LETTER of the pelvis and the NUMBER of the skull of the organism which is bipedal most of its adult life. (2)
3.4.3 Tabulate TWO anatomical differences between skulls 1 and 3 with respect to labels X and Y. (5)
3.4.4 List ONE feature of the teeth of skull 3. (1)
3.4.5 Explain how mitochondrial DNA is used to support the “Out of Africa” hypothesis. (5)
[40]
TOTAL SECTION B: 80
SECTION C
QUESTION 4
Describe the mechanisms that cause variation within a species. (17)
Synthesis (3)
NOTE: NO marks will be awarded for answers in the form of flow charts, tables or diagrams.
TOTAL SECTION C: 20
GRAND TOTAL: 150