GRADE 12 MATHEMATICAL LITERACY PAPER 2 QUESTIONS - NSC PAST PAPERS AND MEMOS NOVEMBER 2017
Share via Whatsapp Join our WhatsApp Group Join our Telegram GroupMATHEMATICAL LITERACY PAPER 2
GRADE 12
NATIONAL SENIOR CERTIFICATE
NOVEMBER 2017
INSTRUCTIONS AND INFORMATION
- This question paper consists of FOUR questions. Answer ALL the questions.
- 2.1 Use the ANNEXURES in the ADDENDUM to answer the following questions:
ANNEXURE A for QUESTION 1.1
ANNEXURE B for QUESTION 1.2
ANNEXURE C for QUESTION 2.3
ANNEXURE D for QUESTION 3.1
ANNEXURE E for QUESTION 3.2
ANNEXURE F for QUESTION 4.2
2.2 Answer QUESTION 4.2.2 on the ANSWER SHEET attached.
2.3 Write your centre number and examination number in the spaces on the ANSWER SHEET. Hand in the ANSWER SHEET with your ANSWER BOOK. - Number the answers correctly according to the numbering system used in this question paper.
- Start EACH question on a NEW page.
- You may use an approved calculator (non-programmable and non-graphical), unless stated otherwise.
- Show ALL calculations clearly.
- Round off ALL final answers appropriately according to the given context, unless stated otherwise.
- Indicate units of measurement, where applicable.
- Maps and diagrams are NOT drawn to scale, unless stated otherwise.
- Write neatly and legibly.
QUESTION 1
1.1 ANNEXURE A shows a summary of the Income and Expenditure statement with notes of the South African National Blood Service (SANBS) for the financial year ended 31 March 2016. Some of the amounts have been omitted.
Use ANNEXURE A and the information above to answer the questions that follow.
1.1.1 Communication costs decreased by 4,402% from 2015 to 2016.
Calculate (to the nearest thousand rand) the communication costs for 2016. (4)
1.1.2 The SANBS imports 75% of its product testing material and consumables. Explain what possible impact a weakening of the rand will have on their
total profit for the year. (2)
1.1.3 Compare, showing ALL calculations, the 2015 and 2016 percentage profit for the SANBS.
You may use the following formula:
Percentage profit = Annual Total Profit x 100% (5)
Total Annual Primary Income
1.2 ANNEXURE B shows the individual tax rates for the 2016/2017 tax year.
One of the SANBS directors, who is 68 years old, earned a taxable income of R663 000 during the 2016/2017 tax year.
Calculate the total income tax this director has to pay on his annual taxable income (ignore medical aid credits).(6)
1.3 During 2016, a total of 110000 South Africans in the age group 16 to19 years donated blood. The SANBS decided to appeal to eligible high-school learners to donate blood. Their target is to increase the number of donors in this age group by an annual growth rate of 9,6%, compounded over the next two years.
Calculate, showing ALL calculations, the targeted number of blood donors in this age group for 2018. (4)
1.4 The bar graph below shows the racial composition of blood donors from 2014 to 2016 in terms of actual numbers and percentages. 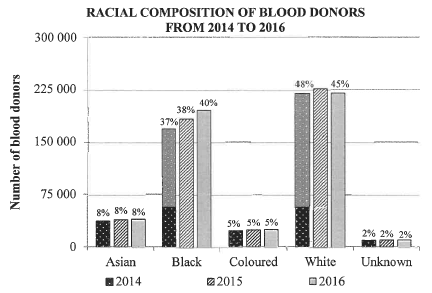
Use the bar graph above to answer the questions that follow.
1.4.1 Give a possible explanation for including an 'Unknown' category as a racial group.
1.4.2 Describe a possible trend relating to the percentage black donors.
1.4.3 Explain why it cannot be said with certainty that the number of Asian donors remained the same from 2014 to 2016.
1.4.4 The total number of donors in 2016 was 490 914. This total donor base grew marginally from the previous year by 1,02%.
- Calculate the number of donors in 2015. (2)
- Hence, determine (rounded off to the nearest 10) the number of white donors in 2015.(4)
1.5 Human blood is classified into eight main blood groups. The SANBS is regularly appealing to eligible people to donate blood. TABLE 2 below shows the distribution of the eight different blood groups in the South African population.
TABLE 3 below shows the compatibility between the blood group of the donor and the possible recipient.
TABLE 2: DISTRIBUTION OF BLOOD GROUPS IN THE SOUTH AFRICAN POPULATION
| BLOOD GROUP | ||||||||
| 0+ | O | A+ | A- | B+ | B- | AB+ | AB- | |
| % Distribution | 39 | 6 | 32 | 5 | 12 | 2 | 3 | 1 |
TABLE 3: COMPATIBILITY BETWEEN DONOR BLOOD GROUP AND POSSIBLE RECIPIENT BLOOD GROUP DONOR BLOOD GROUP
| DONOR BLOOD GROUP | |||||||||
| O+ | O- | A+ | A- | B+ | B- | AB+ | AB- | ||
| RECIPIENT BLOOD GROUP | AB+ | Yes | Yes | Yes | Yes | Yes | Yes | Yes | Yes |
| AB- | Yes | Yes | Yes | Yes | |||||
| A+ | Yes | Yes | Yes | Yes | |||||
| A- | Yes | Yes | |||||||
| B+ | Yes | Yes | Yes | Yes | |||||
| B- | Yes | Yes | |||||||
| O+ | Yes | Yes | |||||||
| O- | Yes | ||||||||
1.5.1 Write down the probability of randomly selecting a South African who is classified in the 0 blood group.(2)
1.5.2 Identify the blood group of a recipient that has a 100% probability of being able to receive blood from any donor blood group.(2)
1.5.3 Verify, with a reason, whether it is most likely for an O blood group recipient to be able to receive blood from any donor blood group(3)
QUESTION 2
2.1 The cost of fuel in South Africa is made up of the basic fuel price and other costs, as shown in the infographics below.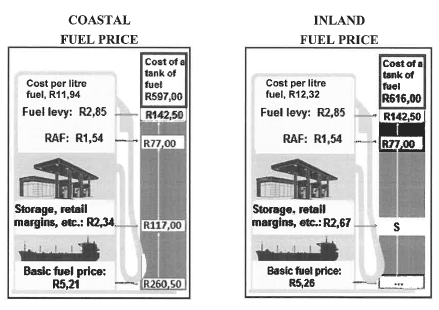
Other costs include:
- Transport
- Customs and excise duties
- Retail margins paid to fuel station owners
- Secondary storage
- Fuel levy
- Road Accident Fund (RAF) levy
Use the information above to answer the questions that follow.
2.1.1 Explain why the inland and coastal fuel prices are not the same. (2)
2.1.2 Calculate the missing value S. (3)
2.1.3 Jabu's vehicle has an average fuel consumption of 7,3 litres per 100 km. Jabu stated that it cost her R50 more for fuel to travel 1 250 km in an inland region than it cost to travel the same distance in the coastal region. Verify, showing ALL calculations, whether Jabu's statement is valid. (5)
2.2 In his 2017/2018 budget speech the Minister of Finance announced an increase in fuel levies and stated that the projected income from the fuel levies would be R70,9 billion. The income from the fuel levies for 2016/2017 was R54 billion.
2.2.1 Determine the percentage increase in the income received from the fuel levies for 2017/2018. (3)
2.2.2 Calculate (to the nearest billion rand) the total national budgeted income for the financial year 2017/2018 if the ratio of the income received from fuel levies to other income received is 7 : 118.(4)
2.3 TABLE 4 in ANNEXURE C shows the ranking for a sample of 11 countries according to:
- Mean fuel price per gallon in Russian rouble
- Affordability of a gallon of fuel as a percentage of the mean daily wage in each country
- Percentage mean income spent on fuel
Use ANNEXURE C to answer the questions that follow.
2.3.1 Identify the country that is the median of the percentage mean income spent on fuel.
2.3.2 Determine the interquartile range of the mean income spent on fuel.
2.3.3 Give ONE valid reason why the sample is considered unbiased with respect to the percentage mean income spent on fuel.
2.3.4 Determine the difference (in Russian rouble) between the mean daily wage in India and South Africa.
2.3.5 A learner's solution for calculating the range (in rand per gallon) of the mean fuel prices is shown below.
| LEARNER'S SOLUTION |
Range = 425,52 — 21,44 |
404,08 Russian rouble = 404,08 ± 0,016 |
25 255 euro = 25 255 x 0,07 |
Verify, showing ALL calculations, whether the learner's solution is correct. (6)
[37]
QUESTION 3
3.1 ANNEXURE D shows the location of Lizette's property, marked H (which includes the house), on the map of Mandela Park. The new extension is indicated using dark, bolder lines, as shown on the map. An enlargement of a section of the main map is also shown.
Use ANNEXURE D to answer the questions that follow.
3.1.1 If the numbering system for the properties follows the same pattern, as shown on the main map, determine the street address of the property marked H. (3)
3.1.2 Use measurement and the given scale to determine the actual dimensions (in metres) of the rectangular property marked H. (6)
3.1.3 Lizette stated that the enlargement is 5 times bigger than the corresponding section on the main map. Verify, showing ALL calculations, whether her statement is valid. (4)
3.2 ANNEXURE E shows the floor plan of a rectangular room that Lizette wants to add to her property. The room will have a roof and a ceiling with cornices.
Other information:
- Exterior measurements of the room are 5 240 mm x 4 040 mm
- The walls have a uniform thickness of 220 mm
- The ceiling boards only cover the internal area of the ceiling of the room
- Cornices (a decorative edge) will be placed between the walls and the ceiling right around the ceiling of the room, as shown in ANNEXURE E
You may use the following formulae:
Area of a rectangle = length x width
Perimeter of a rectangle = 2 x (length + width)
3.2.1 Calculate (in m2) the floor area of the room. (6)
3.2.2 The dimensions of each of the ceiling boards she intends using:
900 mm x 2 400 mm
Determine, showing ALL calculations, whether a minimum of seven ceiling boards would be needed for this room. (5)
3.2.3 Calculate (in mm) the exact length of cornices needed for this room.(3)
3.2.4 TABLE 5 below shows the price list of materials that can be used.
TABLE 5: PRICE LIST OF MATERIALS (INCLUDING VAT
| CEILING BOARDS | LENGTH (in mm) | PRICE (in R) |
| 4 mm x 900 mm | 2 400 | 91,44 |
| 4 mm x 900 mm | 3 000 | 114,31 |
| DECORATIVE MOULDINGS | LENGTH (in mm) | PRICE (in R) |
| Cornice | 2 000 | 53,64 |
Lizette stated that the total cost of the materials (ceiling boards and cornices) (including VAT) would be less than R1 250.Verify, showing ALL calculations, whether her statement is CORRECT.(5)
3.3 Lizette also plans to install an underground cylindrical water storage tank on her property, as shown in the diagrams below.
You may use the following formula: |
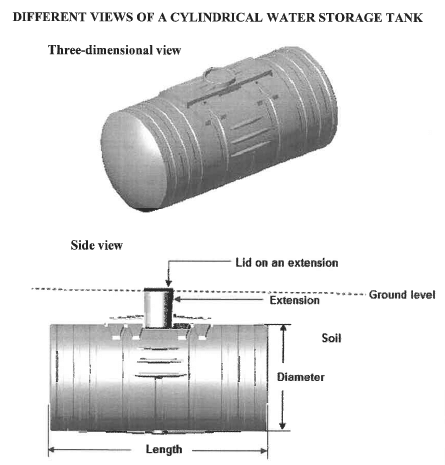
3.3.1 Give ONE possible reason why Lizette would plan to install the water storage tank underground. (2)
3.3.2 Calculate (in m) the diameter of the water storage tank. (6)
[40]
QUESTION 4
4.1 During February 2017 tropical storm Dineo caused damage to property in Mozambique, but it also brought much needed rain. Below is a chart issued by Meteo France (the French weather office) showing the projected path of the storm as well as likely affected land areas.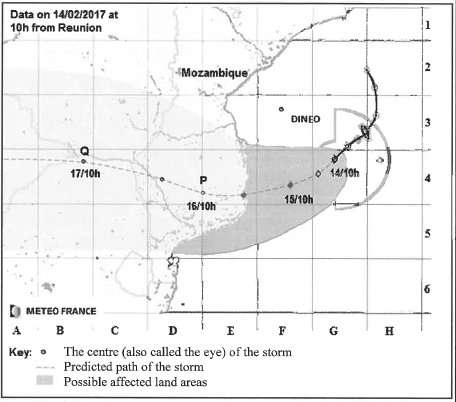
4.1.1 Dineo was classified as a Category 1 tropical storm with a maximum average wind speed of 95 miles per hour.
NOTE: 50 miles = 80,4672 km
Convert (rounded off to TWO decimal places) the maximum average wind speed to kilometres per hour. (3)
4.1.2 The distance between two vertical gridlines on the map is approximately 205,043 km.
Calculate, using the measured distance, the predicted average speed (in km/h) of the storm from point P to point Q.
You may use the following formula:
Distance = average speed x time (8)
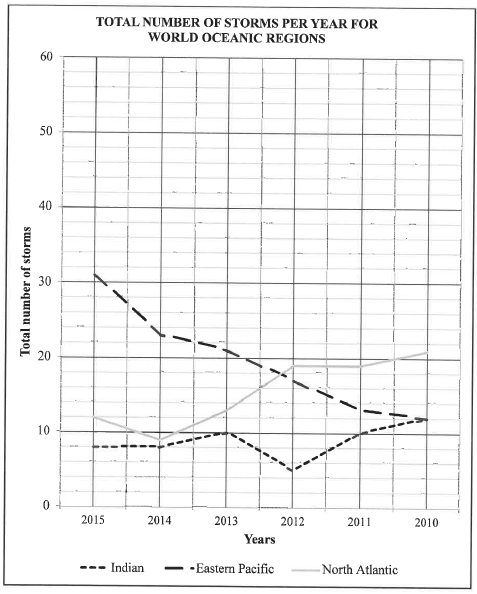
4.2 TABLE 6 on ANNEXURE F shows the total number of storms from 2010 to 2015 that affected four world oceanic regions, as well as the cost of damages (in millions US dollars (USD)) during this period. Some of the data in the table have been omitted.
Broken line graphs representing the number of storms for three regions have been drawn on the ANSWER SHEET.
Use TABLE 6 and the graph on the ANSWER SHEET to answer the questions that follow.
4.2.1 Determine the missing value N. (2)
4.2.2 Draw another broken line graph on the ANSWER SHEET representing the total number of storms affecting the Western Pacific region from 2010 to 2015. (5)
4.2.3 Name the region that showed a downward trend in the number of storms experienced from 2010 to 2014.(2)
4.2.4 A news reporter compared the total cost of damage caused in the Western Pacific and North Atlantic regions to the total number of storms from 2011 to 2015. He stated that the more storms a region experienced, the greater the amount of the damage caused by them.
Verify (showing ALL calculations and give a reason) whether his statement is valid. (9)
4.3 In 2016 the Mozambican information department recorded the following data:
- Birth rate is 38,3 births per 1 000 population
- Death rate is 11,9 deaths per 1 000 population
- Net migration rate is —1,9 migrants per 1 000 population
Determine Mozambique's percentage population growth rate for 2016. (4)
[33]
TOTAL: 150
ANSWER SHEET
QUESTION 4.2.2
CENTRE NUMBER:
EXAMINATION NUMBER:
TOTAL NUMBER OF STORMS PER YEAR FOR WORLD OCEANIC REGIONS