MATHEMATICAL LITERACY PAPER 1 GRADE 12 QUESTIONS - AMENDED SENIOR CERTIFICATE PAST PAPERS AND MEMOS MAY/JUNE 2016
Share via Whatsapp Join our WhatsApp Group Join our Telegram GroupMATHEMATICAL LITERACY PAPER 1
GRADE 12
SENIOR CERTIFICATE EXAMINATIONS
2016
INSTRUCTIONS AND INFORMATION
- This question paper consists of FIVE questions. Answer ALL the questions.
- Use the ANNEXURES in the ADDENDUM to answer the following questions:
- ANNEXURE A for QUESTION 1.1
- ANNEXURE B for QUESTION 2.1
- ANNEXURE C for QUESTION 3.1
2.2 Answer QUESTION 3.2.5 and QUESTION 4.8 on the attached ANSWER SHEETS.
2.3 Write your centre number and examination number in the spaces on the ANSWER SHEETS. Hand in the ANSWER SHEETS with your ANSWER BOOK
- Number the answers correctly according to the numbering system used in this question paper.
- Start EACH question on a NEW page.
- You may use an approved calculator (non-programmable and non-graphical), unless stated otherwise.
- Show ALL calculations clearly.
- Round off ALL final answers appropriately according to the given context, unless stated otherwise.
- Indicate units of measurement, where applicable.
- Maps and diagrams are NOT necessarily drawn to scale, unless stated otherwise.
- Write neatly and legibly.
QUESTION 1
| Valley High School received an electricity account statement for the school from the Khara Hais Municipality. ANNEXURE A shows an adapted version of the account statement with some values and amounts omitted. |
Use ANNEXURE A to answer the questions that follow.
1.1.1 Explain the term balance brought forward. (2)
1.1.2 Calculate the number of days that lapsed between the previous meter reading and the meter reading for this account statement.(3)
1.1.3 Determine the total basic levy amount payable, excluding VAT.(2)
1.1.4
- Show, using the meter readings, that the missing value
A=31 829 kWh(2) - Hence, show how the amount of R20 061,82 was calculated.(2)
1.1.5 Show that the amount of R6 875,14 charged for VAT was calculated correctly. (3)
1.1.6 Calculate tariff B that the municipality charges for kVA.(2)
1.1.7 Calculate the missing value C.(2)
1.1.8 Give a reason why an amount of 3 cents was deducted from the account. (2)
1.1.9 Accounts unpaid on the date payable are subject to interest at a rate of 10% per annum, compounded monthly. Assume that this account was only paid on 15 December 2015. Calculate the total amount payable, including interest. Show ALL calculations. (5)
1.1.10 The school received a notice from the municipality that the proposed increases for 2016 would be as follows:
- All basic levies would increase by R50 per month
- The tariff increase per kWh for 2016 would be 12,2%. • The KVA tariff would remain unchanged.
- Calculate the three-phase commercial levy for 2016. (2)
- Determine the new tariff per kWh for 2016.(3)
1.2 The Makiti Municipality published their financial statements for the years ended June 2013 and June 2014 for different departments of the municipality, labelled A to G, as shown in TABLE 1 below.
TABLE 1: FINANCIAL PERFORMANCE OF DEPARTMENTS FOR THE YEARS ENDED JUNE 2013 AND JUNE 2014 2013 2014
| DEPARTMENT | 2013 | 2014 | |||
| INCOME IN RAND | EXPENDITURE IN RAND | INCOME IN RAND | EXPENDITURE IN RAND | SURPLUS OR DEFICIT IN RAND | |
| A | 48 388 125 | 29 610 185 | 65 771 447 | 28 490 095 | ? |
| B | 1 609 653 | 52 554 248 | 4 198 816 | 57 060 221 | (52 861 405) |
| C | 1 308 287 | 4 998 399 | 1 216 484 | 4 607 201 | (3 390 717) |
| D | 6 855 006 | 9932 644 | 6 151 138 | 7 254 832 | (1 103 694) |
| E | 6 979 909 | 22 447 349 | 6530 785 | 23 375 380 | (16 844 595) |
| F | 39 770 950 | 41 774 804 | 46 764 108 | 52 237 114 | (5473 006) |
| G | 21 231 361 | 30 645 928 | 4 505 986 | 33 031 602 | (28 525 616) |
Study TABLE 1 above and answer the questions that follow.
1.2.1 Explain the term deficit. (2)
1.2.2 Determine, by showing ALL calculations, whether Department A showed a surplus or deficit in 2014.(2)
1.2.3 Write the income amount for Department for 2013 in words.(2)
1.2.4 Identify the department that showed the greatest deficit for both 2013 and 2014.(2)
1.2.5 Calculate the percentage difference (rounded off to the nearest whole percentage) in the expenditure of Department G from 2013 to 2014, using the following formula:
% differences = expenditure 2014 - expenditure 2013 x 100% (3)
expenditure 2013
1.2.6 Calculate the probability (expressed as a percentage) of randomly selecting a department that had expenditures of less than 25 million rand in 2014.(3)
[44]
QUESTION 2
2.1
| Malibongwe owns a guest farm with four holiday cottages. He decides to use bricks to build a braai stand for each cottage. The picture and diagrams in ANNEXURE B show the dimensions and different views of a braai stand NOTE: There is 10 mm mortar (cement mix) between the bricks. The bricks are rectangular prisms with a length of 22 cm each. |
Use ANNEXURE B to answer the questions that follow.
2.1.1 Malibongwe decides to clear an area to create a uniform 250 mm border around the base of the braai stand (as shown on ANNEXURE B).
- Determine the length and width of the rectangular area to be cleared to build one braai stand (3)
- Hence, calculate the total area of ground (in m') to be cleared to build one braai stand You may use the following formula:
Area of rectangle = length x width (3)
2.1.2 A is the width of the open space in which the braai grill will fit exactly. The width, A, is equal to the length of two bricks plus the mortar between the bricks.
Show that A is equal to 470 mm.(3)
2.1.3 Malibongwe decides to use a rectangular cement slab, B, to cover part of the braai stand's top. The cement slab has the following dimensions:
- Thickness/Height = 3,5 cm • Length = 920 mm
- Width = (2½ x length of a brick) + mortar
- Determine the width of the cement slab.(2)
- Hence, determine the volume (in cm') of ONE cement slab.
You may use the following formula:
Volume of rectangular prism = length x width x height(3)
2.2
A high school decided to install 15 rectangular locker cabinets with a square base. Each cabinet has a set of 10 individual lockers, as indicated in the diagram and photograph below. The frame around the set of lockers has a uniform width of 4 cm.
You may use the following formulae: Area of rectangle = length × width |
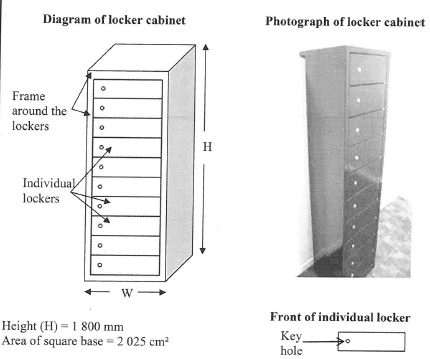
2.2.1 Calculate the height (in mm) of an individual locker. (3)
2.2.2
- Determine the side length (in cm) of the square base. (2)
- Hence, determine the total floor area in m all the locker cabinets occupied by the bases of all the locker cabinets (2)
2.2.3 Each circular key hole in a locker has a diameter of 3 cm.
- Show that the area cut out of a locker's door for a key hole is 7,0695 cm2 (3)
- Hence, determine the total surface area (in cm2) of the front face of a locker cabinet, excluding the key holes. (4) [28]
QUESTION 3
3.1
| Tebogo visited the Kruger National Park. He arrived at the Kruger Mpumalanga International Airport. A map showing the access roads to the park and the airport is provided in ANNEXURE C. National roads are indicated with the letter N and regional roads with the letter R |
Use ANNEXURE C to answer the questions that follow.
3.1.1 Name the entrance gate to the Kruger National Park that is furthest from the airport. (2)
3.1.2 Identify ALL the different regional roads shown on this map that do NOT directly connect to the N4.(2)
3.1.3 Name the single road that could be used to travel from Klasserie to Barberton. (2)
3.1.4 Tebogo left the Kruger National Park to meet a friend in a town outside the park. He took the following route:
- From the Orpen Gate he drove to Klasserie.
- He turned left on the R40 and drove through Bushbuckridge to Hazyview.
- He then took the R536 to Sabie.
- He then drove along the Long Tom Pass and met his friend in the next town on the route.
Write down the name of the town where they met. (3)
3.1.5 Give the general direction of the Blyde River Canyon from the Paul Kruger Gate.(2)
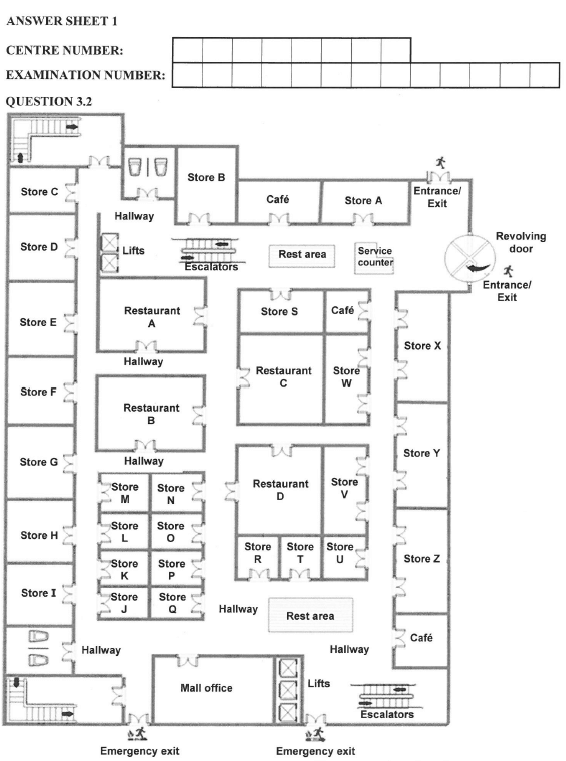
3.2 The floor plan of a shopping mall is given on ANSWER SHEET 1. Study the floor plan and answer the questions that follow.
3.2.1 Name THREE features on the floor plan that indicate that the mall is a multilevel building(3)
3.2.2 State whether the revolving door at the exit/entrance turns in a clockwise direction or an anticlockwise direction.(2)
3.2.3 Store A and Store B are labelled S101 and S102 respectively where A and B are the first two letters of the alphabet. Give the labelling for Store X(2)
3.2.4 The entrances of Store M and Store L are 20 mm apart on the floor plan. The actual distance between the entrances is 5 m. Determine the scale of this floor plan. (3)
3.2.5 Clearly show, on ANSWER SHEET I, the shortest possible route a person could follow to the nearest exit in case of an emergency evacuation if the person exits Restaurant C.(3) [24]
QUESTION 4
TABLE 2 below shows a comparison of different food items consumed in South Africa.
TABLE 2: COMPARISON OF DIFFERENT FOOD ITEMS CONSUMED IN SOUTH AFRICA FROM 1994 TO 2009
| FOOD ITEM | CONSUMPTION (kg/year) | ||||
| 1994 | 1999 | 2004 | 2009 | % CHANGE 1994 (1994 TO 2009) | |
| Total meat (i) (v) | 40,3 | 37,2 | 43,8 | 58,7 | 45,7 |
| (i) Beef | 16,6 | 11,5 | 13,8 | 15,4 | -7,0 |
| (ii) Mutton | 4,0 | 4,2 | 3,7 | 3,8 | -5,0 |
| (iii) Pork | 3,1 | 3,0 | 3,6 | 6,8 | 119,0 |
| (iv) Poultry | 15,3 | ... | 22,4 | 32 | 109 |
| (v) Other meat | 1,3 | 0,3 | M | 0,7 | -46,0 |
| Total offal | 3,6 | 3,4 | 4,2 | 4,7 | 30,6 |
| Total eggs | 4,3 | 5,6 | 5,7 | 6,7 | 55,8 |
| Total fish and seafood food | 5,9 | 6,5 | 9,9 | 7,5 | 27,0 |
*kg/year = kilogram weight of food item consumed by an individual per year
Use the table above to answer the questions that follow.
4.1 Briefly explain whether the consumption data in the table is discrete or continuous.(2)
4.2 Identify the meat item which showed the largest percentage decrease in consumption and also state the percentage decrease.(3)
4.3 Calculate the average total consumption of eggs in 2009 (in kg) if the total population in South Africa in 2009 was estimated at 49 320 500.(3)
4.4 Calculate the missing value M.(3)
4.5 Name the food item where the consumption per person per year increased by 1 kg from 1999 to 2009.(2)
4.6 Arrange the percentage change of the meat items in ascending order.(3)
4.7 Write down the modal percentage change of egg consumption from 1994 to 2009.(2)
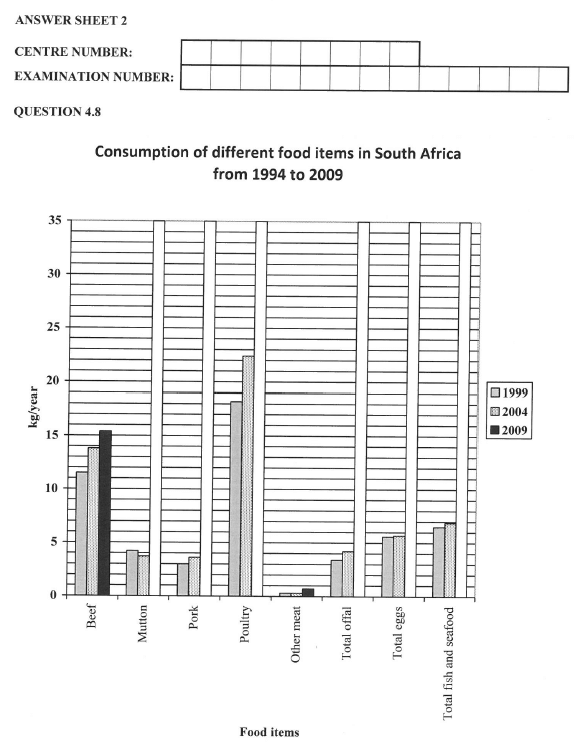
4.8 On ANSWER SHEET 2 completed bar graphs representing the consumption of different food items are given for 1999 and 2004. An incomplete bar graph is also given to represent food items for 2009
Use the information in TABLE 2 above and complete the bar graph for the food items for 2009 on ANSWER SHEET 2. (6) [24]
QUESTION 5
5.1 Rori is currently employed and decides to start saving for 10 years by using a tax-free savings plan where no tax is paid on investment growth The tax-free savings plan has the following two options to choose from:
- OPTION 1: An initial fixed monthly contribution with an inflation-linked annual increase
- OPTION 2: An initial fixed monthly contribution with an annual increase of 8%
The table below shows the total value of the savings if no withdrawals are made, as well as the tax savings on the various contributions for a period of ten years.
TABLE 3: VALUE OF TAX-FREE SAVINGS PLAN AFTER TEN YEARS
| INITIAL MONTHLY CONTRIBUTION (R) | OPTION 1:INFLATION-LINKED ANNUAL INCREASE | OPTION 2: ANNUAL INCREASE OF 8% | ||
| TOTAL VALUE OF SAVINGS (R) | TAX SAVINGS (R) | TOTAL VALUE OF SAVINGS (R) | TAX SAVINGS (R) | |
| 150 | 30 434 | 1558 | 30 434 | 1 558 |
| 200 | 40 578 | 2077 | 40 578 | 2 077 |
| 300 | 60 867 | 3116 | 60 867 | 3116 |
| 500 | 112 043 | 5365 | 126 696 | 5805 |
| 800 | 179 269 | 8 584 | 202 714 | 9288 |
| 1000 | 224 086 | 10 729 | 253 392 | 11610 |
5.1.1 Determine the ratio of the tax savings to the total value of the savings for an initial monthly contribution of R500 if OPTION 1 is chosen. Express the answer in the form 1 : ... (3)
5.1.2 For which monthly contribution amounts will the tax savings be the same regardless of the option chosen?(2)
5.1.3 Express the tax savings on an initial monthly contribution of R800 as a percentage of the total value of the savings for OPTION 2(3)
5.1.4 State whether the monthly contribution that Rori makes to this tax-free savings plan will be a fixed or variable expense in his monthly budget per year.(2)
5.1.5 Determine how much more Rori's total savings will be worth if he chooses to make a monthly contribution of R500 for 10 years, choosing OPTION 2 rather than OPTION 1.(2)
5.2 TABLE 4 below shows the net worth of the world's ten richest billionaires in 2015 and TABLE 5 below shows the net worth of the ten richest billionaires in Africa in 2015.
TABLE 4: TEN RICHEST BILLIONAIRES IN THE WORLD 2015
| NAME | NET WORTH (IN BILLION DOLLARS) | COUNTRY OF CITIZENSHIP |
| Jim Walton | 40,6 | USA |
| Larry Ellison | 54,3 | USA |
| Warren Buffet | 72,7 | USA |
| Charles Koch | 42,9 | USA |
| Amancio Ortega | 64,5 | Spain |
| Bill Gates | 79,2 | USA |
| David Koch | 42,9 | USA |
| Liliane Bettencourt (F) | 40,1 | France |
| Christy Walton | 41,7 | USA |
| Carlos Slim Helu | 77,1 | Mexico |
TABLE 5: TEN RICHEST BILLIONAIRES IN AFRICA 2015
| NAME | NET WORTH (IN BILLION DOLLARS) | COUNTRY OF CITIZENSHIP |
| Nathan Kirsh | 3,9 | Swaziland |
| Nicky Oppenheimer | 6,7 | South Africa |
| Isabel dos Santos (F) | 3,3 | Angola |
| Johann Rupert | 7,4 | South Africa |
| Aliko Dangote | 15,7 | Nigeria |
| Mohamed Mansour | 4,0 | Egypt |
| Nassef Sawiris | 6,3 | Egypt |
| Christoffel Wiese | 6,3 | South Africa |
| Issad Rebrab | 3,1 | Algeria |
| Mike Adenuga | 4,0 | Nigeria |
Use TABLE 4 and TABLE 5 above to answer the questions that follow.
5.2.1 Who was the sixth richest billionaire in the world in 2015? (3)
5.2.2 Determine the difference in net worth between the richest billionaire in the world and the richest billionaire in Africa.(3)
5.2.3 Calculate the median net worth of the world's ten richest billionaires. (3)
5.2.4 Calculate the mean net worth of Africa's ten richest billionaires.(3)
5.2.5 Determine the probability that one of the ten richest billionaires in Africa is a South African citizen whose net worth is less than 7 billion dollars. Write your answer as a simplified common fraction(3)
5.2.6 Determine Christoffel Wiese's net worth in rand if the current exchange rate is R1 = $0,0606. Round off the net worth to the nearest million.(3) [30]
TOTAL: 150