Geography P2 Grade 12 Memorandum - NSC Exams Past Papers and Memos September 2019 Preparatory Examinations
Share via Whatsapp Join our WhatsApp Group Join our Telegram GroupMARKING GUIDELINE
QUESTION 1: MULTIPLE-CHOICE QUESTIONS
The questions below are based on the 1 : 50 000 topographic map (2529CC WITBANK) as well as the orthophoto map of a part of the mapped area. Various options are provided as possible answers to the following questions. Choose the answer and write only the letter (A–D) in the block next to each question.
1.1 D
1.2 B
1.3 D
1.4 B
1.5 C
1.6 D
1.7 D
1.8 D
1.9 B
1.10 D
1.11 B
1.12 C
1.13 A
1.14 A
1.15 C
(15 x 1) [15]
QUESTION 2: MAPWORK CALCULATIONS AND TECHNIQUES
2.1 Products from Witbank are transported along the N4 national road to Pretoria.
2.1.1 Determine if vehicles travelling along the N4 from 5 to 6 on the orthophoto map will drive uphill or downhill.
- Downhill (1 x 1) (1)
2.1.2 Give a reason for your answer to QUESTION 2.1.1.
- Contour heights are descending/decreasing from 5 to 6 (Candidates can give examples of actual height/readings from the map) (1 x 1) (1)
2.2 Locate line 7–8 on the orthophoto map.
2.2.1 Calculate the average gradient between the car park point 7 (1593) and 8 on the orthophoto map. Show ALL calculations. Marks will be awarded for calculations.
- Formula: Gradient = Vertical Interval (V.I.)
Horizontal Equivalent (H.E.)
VI = 1 593 m – 1 580 m = 13 m VI = 1 593 m – 1 580 m = 13 m
OR
HE = 6,7 cm x 100 m 6,7 cm x 10 0000 cm
100
[Range 6,6 cm to 6,8 cm]
= 670 m = 670 m
[Range 660 m – 680 m]
G = ( 13 ) [1 mark for correct substitution] (13 ∶670)
670 13 13
= 1 or 1 : 51,5 = 1 : 51,5
51,5
Range [1 : 50,76 – 1 : 52,31]
(5 x 1) (5)
2.3 2.3.1 Calculate the magnetic bearing from point D, in block B5, to point E in block C4 for 2019.
Show ALL calculations. Marks will be awarded for calculations.
- Formula: MB = TB + MD
Bearing: 232° [Range 231° – 233°]
Difference in years: 2019 – 2002 = 17 years
Mean annual change: 8' W
Total change: 17 x 8' W = 136' (2˚16') W
Magnetic declination for 2019: 17°25' W + 2 °16' W = 19°41' W
Magnetic bearing for 2019: 232° + 19°41 = 251 ° 41'
(7 x 1) (7)
2.3.2 State the importance of calculating the magnetic declination for the present year.
- By correcting the magnetic declination, it will allow you to get the correct direction when using a map in the field.
- By correcting the magnetic declination, it will allow you to calculate the correct magnetic bearing.
- You will be able to get the correct direction when using a magnetic compass as you will have the correct magnetic declination.
- Prevent getting lost
- Determine True North
- Orientate the map
- Magnetic declination changes constantly [Any ONE]
(1 x 1) (1)
2.4 Calculate the area of block A1 on the topographical map, in km². Show ALL calculations.
Marks will be awarded for calculations. Clearly indicate the unit of measurement in your answer.
- Formula: area = length (L) × breadth (B)
3,7 (cm) x 0,5 = 1,85 (km) [Range: 1,8 km – 1,9 km] (3,6 cm to 3,8 cm)
370 mm x 0,05 = 1,85 km
3,3 (cm) x 0,5 = 1,65 (km) [Range: 1,6 km – 1,7 km] (3,2 cm to 3,4 cm)
330 mm x 0,05 = 1,65 km
1,85 km x 1,65 km = 3,05 km² [Range: [2,88 km² – 3,23 km²]
[Accept any other formulas/methods for calculating the length and breadth] (5 x 1) (5) [20]
QUESTION 3: APPLICATION AND INTERPRETATION
3.1 Study the Ferrobank industrial area in block B8.
3.1.1 Is Ferrobank a light or heavy industrial area?
- Heavy industry (1 x 1) (1)
3.1.2 Substantiate your choice in QUESTION 3.1.1.
- Outskirts of Witbank
- Near mass transport routes, e.g. main roads and railways
- Near natural resources and water supplies
- Industry covers a big, level area
- Industry can be easily extended in the future
- Flat land [Any ONE]
(1 x 2) (2)
3.2 Witbank is a central place town according to its main function.
3.2.1 Define a central place town.
- Provides goods and services to surrounding rural population (1 x 1) (1)
3.2.2 Provide topographic and orthophoto map evidences that Witbank is a central place town.
Many urban services:
- Churches
- Schools
- University
- College
- Police stations
- Shops
- Hospitals
- Recreational facilities/Golf course
- People from surrounding rural area can use these urban services
- Transport (Roads/Railway) from different directions converge at Witbank [Any TWO]
(2 x 2) (4)
3.3 Refer to block E10 on the topographic map.
3.3.1 Name TWO natural factors that would discourage mining in block E10 on the topographic map.
- Subsiding ground
- Non-perennial water
(2 x 1) (2)
3.3.2 Explain your answer to QUESTION 3.3.1.
- Subsiding ground – Collapsing of ground (sinkholes) makes it dangerous
- Non-perennial water – May experience seasonal shortage of water
(2 x 2) (4)
3.4 Infrastructure is important for mining in the region. Refer to the Greenside Colliery Mine in blocks H8 and H9 on the topographic map to answer the following questions.
3.4.1 State a form of infrastructure used by the Greenside Colliery Mine.
- Roads
- Railway lines
- Conveyor belt
- Power lines
- Reservoirs
- Furrow [Any ONE]
(1 x 1) (1)
3.4.2 Explain why the infrastructure mentioned in QUESTION 3.4.1 is of importance to the Greenside Colliery Mine.
- Road:
Transportation of coal to other industries e.g. power stations - Railway:
Bulky transportation of coal to industries and exports - Conveyor belt:
Movement of coal to point of distribution – railway line - Powerlines:
Needed for operation of mines / Power Supply - Reservoirs/furrows:
Used in Colliery mine
[Any TWO] (2 x 2) (4)
3.5 Refer to blocks H2 and H3 on the topographic map.
3.5.1 Witbank experiences seasonal rainfall. Give reasons evident in block H2.
- There are dams
- There is a non-perennial river / stream
(2 x 2) (4)
3.5.2 Explain how seasonal rainfall has influenced the location of the cultivated land in block H3.
- The cultivated land is situated along the river / dam.
(1 x 2) (2)[25]
QUESTION 4: GEOGRAPHICAL INFORMATION SYSTEMS (GIS)
4.1 Refer to the picture below of a slimes dam used in the Witbank area and answer the questions that follow.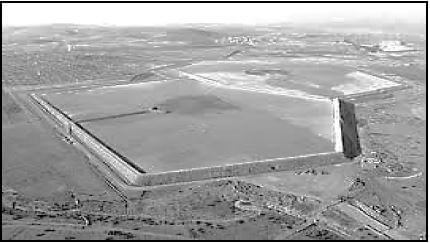
[Source: Google]
4.1.1 What type of spatial object is the slime dam?
- Polygon/area ✔(1 x 1) (1)
4.1.2 Is the picture a raster or vector image?
- Raster ✔(1 x 1) (1)
4.1.3 GIS can be used to predict the amount of water and disposable material entering the dam by integrating different sources of information. What is the term used to describe this process?
- Data integration/data layering/thematic layers ✔(1 x 1) (1)
4.2 The farmer in block H1 decides to use data manipulation to assist in maximising his output and profit from his crop farming.
4.2.1 Explain the term data manipulation.
- When different layers of data are standardised and integrated to use to study a specific problem/query ✔ [Concept] (1 x 1) (1)
4.2.2 Evaluate how data manipulation would assist the farmer in block H1 in maximising his output and profit.
- Gradient – Determine the steepness of land for efficient use of machinery/contour lines ploughing ✔✔
- Drainage density – Distribution of dams/perennial and non-perennial rivers to determine availability of water ✔✔
- Soil – type/fertility found in area affects crops in area ✔✔
- To decide what product, type of farming and farming methods to use to gain maximum use of the area ✔✔
- Accessibility – efficiency of transport network around the farm for transportation of farm products ✔✔
[Any TWO] (2 x 2) (4)
4.3 Refer to area within F in block A5 on the topographic map in which buffering has occurred.
4.3.1 Define buffering.
- It is the demarcation/boundary/delineation/spatial distance of an area around a feature ✔(1 x 1) (1)
4.3.2 What evidence is there that buffering has occurred?
- Housing development built away from marsh and vlei river line ✔
- No development along river / marsh and vlei ✔
- Walls built along river bank to prevent flooding ✔[Any ONE]
(1 x 2) (2)
4.3.3 Explain the positive impact that buffering will have on environmental sustainability in the area in the case of pollution.
- Prevention of water pollution from settlement/farming ✔✔
- Protection of animal / plant habitat ✔✔
- Protection of ecosystem ✔✔
- Stabilises river banks ✔✔
- Aesthetic value – green belt ✔✔
[Any TWO] (2 x 2) (4)
[15]
TOTAL: 75