Mathematics Paper 2 Questions - Grade 12 September 2021 Preparatory Exams
Share via Whatsapp Join our WhatsApp Group Join our Telegram GroupINSTRUCTIONS AND INFORMATION
Read the following instructions carefully before answering the questions.
- This question paper consists of 10 questions.
- Answer ALL the questions in the SPECIAL ANSWER BOOK provided.
- Clearly show ALL calculations, diagrams, graphs, etc. that you have used in determining your answers.
- Answers only will NOT necessarily be awarded full marks.
- You may use an approved scientific calculator (non-programmable and non-graphical), unless stated otherwise.
- If necessary, round off answers correct to TWO decimal places, unless stated otherwise.
- Diagrams are NOT necessarily drawn to scale.
- An information sheet with formulae is included at the end of the question paper.
- Write neatly and legibly.
QUESTIONS
QUESTION 1
An annual sports festival is held over a period of 11 days. A tuckshop sells hot drinks at this festival. On each of the first 10 days, the owner of the tuckshop recorded the temperature at 13:00 and the number of cups of hot drinks sold. This information is presented in the table and scatter plot below.
Temperature (in °C) | 14 | 24 | 26 | 18 | 20 | 28 | 22 | 15 | 12 | 19 | |
Number of hot drinks sold | 410 | 258 | 192 | 324 | 328 | 156 | 280 | 384 | 230 | 280 |
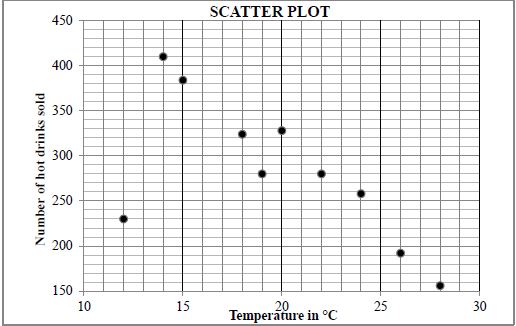
1.1 Describe the trend of the data. (1)
1.2 Determine the equation of the least squares regression line for the data. (3)
1.3 The owner observed that he had used one litre of milk for every 8 cups of hot drinks sold. If the temperature at 13:00 on the 11th day was expected to be 17 °C, predict the number of 1-litre boxes of milk the owner should buy for the 11th day. (3)
1.4 Identify an outlier in the data. (1) [8]
QUESTION 2
2.1 Learners from various schools wrote an aptitude test in order to qualify for a bursary. Their marks (as a percentage) are represented in the ogive (cumulative frequency graph) below.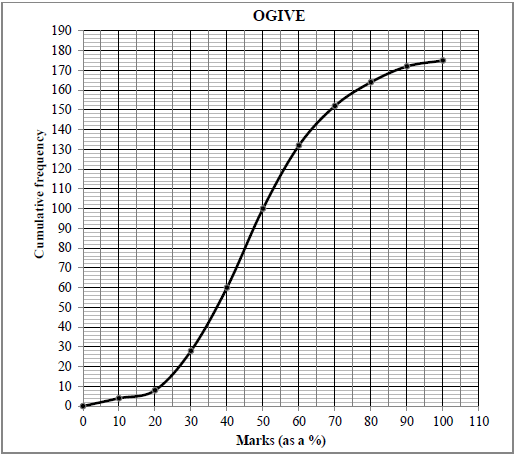
2.1.1 How many learners wrote the test? (1)
2.1.2 Write down the modal class of the data. (1)
2.1.3 The minimum mark to qualify for a bursary is 75%. How many learners qualified for a bursary? (2)
2.2 The table below shows the marks that 15 learners from one particular school obtained in the aptitude test.
Marks (as a %) | 62 | 58 | 78 | 85 | 74 | 48 | 74 | 84 | 100 | 46 | 80 | 92 | 60 | 90 | 92 |
Calculate the:
2.2.1 Mean mark obtained by these learners (2)
2.2.2 Standard deviation of these learners' marks (1)
2.2.3 Number of these learners whose marks lie more than one standard deviation above the mean (2)
2.3 The final Grade 11 marks (as a percentage) obtained by a group of learners was analysed. The one standard deviation interval about the mean was calculated as (82,7 ; 94,1).
Calculate the standard deviation for the final Grade 11 marks. (3) [12]
QUESTION 3
In the diagram below, the line BF is drawn from B(8 ; –2) to cut the x-axis at P and the y-axis at F. The inclination of BF is β and the equation of BF isy = -½x + 2. . From A(4 ; k), another line is drawn parallel to BF and cuts the y-axis at E. The line passing through A and B has an inclination of 45° and cuts the x-axis at C. ABF = θ .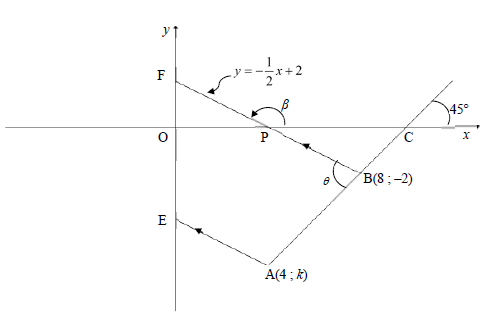
3.1 Calculate the gradient of AB. (1)
3.2 Show that the value of k is –6. (2)
3.3 Determine the equation of EA in the form y = mx + c . (3)
3.4 Calculate the:
3.4.1 Size of θ (3)
3.4.2 Length of BF (3)
3.4.3 Area of ΔABF (4)
3.5 Let G be a point in the fourth quadrant such that APBG is a parallelogram. Calculate the size of PAG. (4)
[20]
QUESTION 4
In the diagram below, S is a point on the x-axis. A circle centred at S and a circle centred at M are drawn. The two circles touch each other externally at E. FE is a common tangent to the circles at E. The circle centred at M, having ER as a diameter, touches the x-axis at P.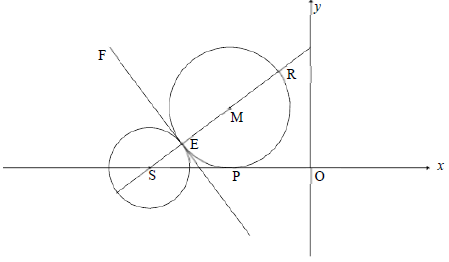
4.1 The equation of the circle centred at S is (x + 8)2 + y2 + 4 .
4.1.1 Write down the coordinates of S. (2)
4.1.2 Show that the diameter of the circle centred at S is 4 units. (1)
4.2 If it is further given that SR = 8 units and ![]() , calculate the:
, calculate the:
4.2.1 Length of EM (2)
4.2.2 Gradient of the tangent FE (3)
4.2.3 Coordinates of M (4)
4.2.4 Coordinates of E (2)
4.3 The circle centred at M(–4 ; 3) is shifted 1 unit to the left and reflected in the x-axis to form a new circle centred at K. Determine whether the point (–8 ; 0) lies inside or outside the circle centred at K. Show ALL calculations. (5)
[19]
QUESTION 5
5.1 Point T(–1; –2) is given in the diagram below. A is a point on the x-axis such that reflex AOT = α.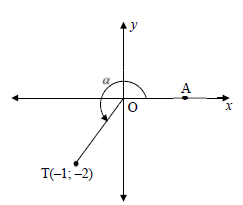
Determine, without using a calculator, the value of each of the following:
5.1.1 tan α (1)
5.1.2 cos α (2)
5.1.3 cos (α + 45º) in simplest form (4)
5.2 Determine, without using a calculator, the value of the following expression:
2 sin(-20º).sin160º - cos 40º (4)
5.3 Consider: 3cos x.sin x + tan x.cos2 (180º - x)
5.3.1 Simplify the expression to a single trigonometric ratio. (4)
5.3.2 Hence, write down the range of:
f (x) = 3cos x.sin x + tan x.cos2 (180º - x) (2)
5.4 Prove the identity: cos 3x = 4 cos2 x - 3 (5)
cos x
5.5 Determine the general solution of x in the following equation:
32 tan x - 3tan x+1 = 54 (5)
[27]
QUESTION 6
In the diagram, the graphs of f (x) = -cosx +1 and g(x) = 2 sin(x + 30º) are drawn for the interval x ∈[-180º; 90º] .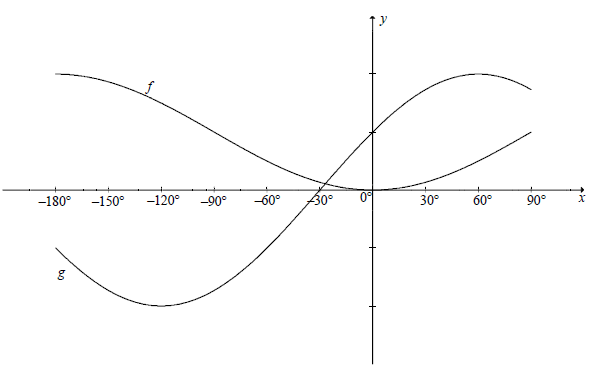
6.1 For which values of x, x ∈[-180º ; 90º] , will:
6.1.1 f(x).g(x) ≥0 (2)
6.1.2 g(x) = -1 (2)
6.2 The y-axis is moved 90° to the right. Determine the new equation of the graph originally called f , in its simplest form. (2)
[6]
QUESTION 7
In the diagram, B, C and D are in the same horizontal plane. AD is a vertical pole anchored by two cables, AB and AC. The angles of elevation from B and C to A, the top of the pole, are θ and 2θ respectively. AB = 5 units and AC = x units.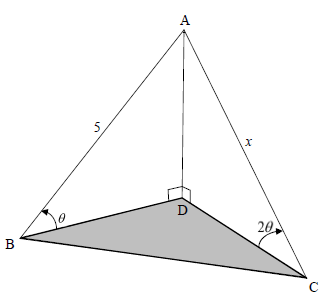
7.1 Show that x = 5 (5)
2 cos θ
7.2 Calculate the length of BC if it is given that BAC = 112º and θ = 30º. (3)
[8]
QUESTION 8
8.1 In the diagram, chords KL, LP and KP are drawn in a circle, centered at O. SLR is a tangent to the circle at L.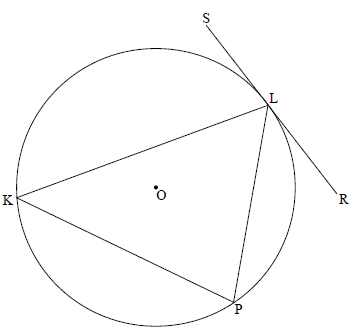
Prove the theorem which states that the angle between the tangent SLR and chord KL is equal to the angle in the alternate segment, that is prove that SLK = P. (6)
8.2 In the diagram below, PWRS is a cyclic quadrilateral in the circle, centered at O. ∆PSW is an equilateral triangle. TW is a tangent to the circle at W. Radii OR and OW are drawn. W5 = 25º.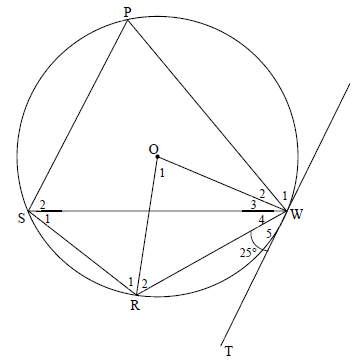
8.2.1 Determine, giving reasons, the size of:
- S1 (2)
- O1 (2)
- R1 (5)
8.2.2 Prove that SP || TW. (3)
8.3 In the diagram below, a circle centered at O is drawn. H, J, G and L are points on the circle. ∆HJL is drawn. HOG bisects JL at M.
HJ = 12√5 units and JM = 12 units.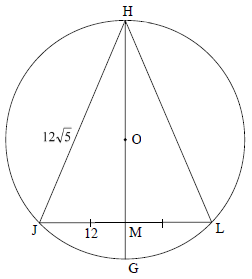
8.3.1 If MG = 6 units and OM = x, write HM in terms of x. (2)
8.3.2 Calculate, giving reasons, the length of the radius of the circle. (5)
[25]
QUESTION 9
In the diagram below, P, Q, R and S are points on a circle. PS, PQ and PR are produced to V, T and W respectively. VT || SQ and SR || VW.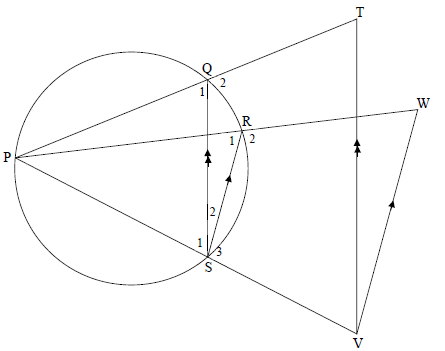
Prove, giving reasons, that:
9.1 TQ = WR (3)
QP RP
9.2 TPVW is a cyclic quadrilateral (5)
[8]
QUESTION 10
In the diagram below, B, C and D are points on a circle such that BC = CD. EC and ED are tangents to the circle at C and D respectively. BC produced meets tangent DE produced at F. B = x .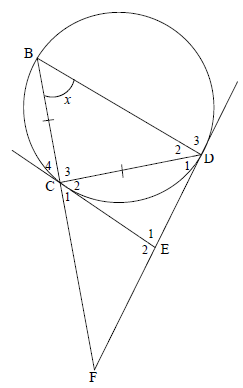
10.1 Prove, giving reasons, that:
10.1.1 E1 = 180º - 2x (5)
10.1.2 ∆ECD ||| ∆CBD (3)
10.2 Prove, giving reasons, that:
10.2.1 CD2 = CE.BD (3)
10.2.2 CF2 = BD (6)
EF2 DE
[17]
TOTAL: 150
INFORMATION SHEET