Mathematical Literacy Paper 1 Questions - Grade 12 September 2021 Preparatory Exams
Share via Whatsapp Join our WhatsApp Group Join our Telegram GroupINSTRUCTIONS AND INFORMATION
- This question paper consists of FIVE questions. Answer ALL the questions.
- 2.1 Use ANNEXURE A for QUESTION 1.4 ANNEXURE B for QUESTION 2.3 ANNEXURE C for QUESTION 5.2 ANNEXURE D for QUESTION 5.2
2.2 Write your NAME and GRADE in the spaces provided on the ANSWER SHEET FOR QUESTION 3.8 (GRAPH).
Hand in the ANSWER SHEET with your ANSWER BOOK. - Number the answers correctly according to the numbering system used in this question paper.
- Diagrams are not necessarily drawn to scale, unless stated otherwise.
- Round off ALL final answers according to the context used, unless stated otherwise.
- Indicate units of measurement, where applicable.
- Start EACH question on a NEW page.
- Show ALL calculations clearly.
- Write neatly and legibly.
QUESTIONS
QUESTION 1
1.1
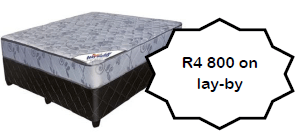
James bought a double bed on lay-by for R4 800. He paid a deposit of R1 200 and opted to pay instalments of R400 each month to complete the balance of R3 600. |
[Adapted from russels.co.za] |
1.1.1 Express the deposit as a percentage of the lay-by purchase price. (2)
1.1.2 Determine the number of months to complete paying for the balance. (3)
1.1.3 Calculate the balance amount after James paid the deposit and seven instalments. (2)
1.2
Morgan started an online clothing store. The t-shirt below was designed in association with the The Saartjie Baartman Centre for Women and Children, to make people aware of women and children abuse. Below are the cost structures for this t-shirt.
|
[Source: www.clothingcloset.com] |
1.2.1 Write down the cost price that Morgan must pay to get the t-shirt ready for sales. (2)
1.2.2 Calculate the profit she will make on one (1) t-shirt. (2)
1.2.3 Complete the income formula for Morgan below: Income (Rands) = … where n stands for the number of t-shirts sold. (2)
1.2.4 As a special during Woman’s Month, she runs a promotion on Facebook with a 15% discount. Calculate the cash discount. (3)
1.3
| Mary bought a tray of 60 eggs at a cost of R110. She sold half of the eggs at a price of R65 and the remaining eggs at a price of R60. |
1.3.1 Calculate the cost price of a dozen eggs. (2)
1.3.2 Calculate the average profit per egg made from the sale of the 60 eggs. (3)
1.4
| The population of South Africa in 1996; 2001 and 2011 is indicated in the TABLE 1 in ANNEXURE A. |
Use ANNEXURE A to answer the questions that follow.
1.4.1 Write down the total population of South Africa in 2001 in words. (2)
1.4.2 Determine the increase in the total population of South Africa from 1996 to 2011. (2)
1.4.3 Write down the difference in population between the KZN and NC provinces in 1996. (3)
1.4.4 Write down the province whose total population decreased in the 2001 census compared to the census. (2)
[30]
QUESTION 2
2.1
On the 1st January 2019, Amoti and Dan invested in a school canteen business. They invested a total of R16 000 in the ratio of 5 : 3 respectively. For the same period Mary chose to invest R10 000 in ADC Bank that offered her an interest rate of 8,5% per annum compounded annually. |
Use the above information to answer the questions that follow.
2.1.1 Calculate the amount Dan invested in the school canteen business. (2)
2.1.2 Determine Dan’s share of the profit on his investment after two years. (2)
2.1.3 Calculate the total interest Mary earned in 2 years, and compare it with Amoti’s share of their profit, to verify who had the better investment. (6)
2.2
Mr Amoti studied his electricity bill and saw that he used 690 kWh of energy for the previous month. TABLE 2: ELECTRICITY TARIFFS FOR FLATS / HOUSES
[Adapted from electricity-tariffs 2018–2019-Johannesburg] |
Use the information in TABLE 2 above to answer the questions that follow.
2.2.1 Write down the monthly service charge (in Rands) to be paid for a flat or house. (2)
2.2.2 Calculate the electricity bill (in Rands) for Mr Amoti for the previous month. (5)
2.2.3 Calculate the VAT amount included in the electricity bill paid for a domestic use of 690 kWh of energy. (3)
2.3
| The GMT Missions Shelter is a non-profit organisation that provides shelter, food, clothing and schooling to abandoned and destitute children. The treasurer of the organisation presented a financial report to all its stakeholders for the 2020/2021 financial year as shown in ANNEXURE B. |
Use the above information and ANNEXURE B to answer the questions that follow.
2.3.1 Determine the time period of the financial report, in months. (2)
2.3.2 Verify, showing all calculations, whether the GMT Missions Shelter organisation has shown a surplus or a deficit. (6)
2.3.3 Calculate the average monthly amount that was paid for bank charges. (3)
[31]
QUESTION 3
Mining plays a significant role in the economy of our nation. The information below indicates how the mining industry performed in 2019.
|
Use the above information in TABLE 3 to answer the questions that follow.
3.1 Identify the type of ‘metals and minerals’ that paid the lowest amount of royalties. (2)
3.2 Determine the median value for the total sales. (3)
3.3 Use calculations to determine if the interquartile range for the total sales of the metals and minerals is less than 101 billion rand. (5)
3.4 Determine the mean number of direct employees in the mining industry. Give your final answer to the nearest thousand. (4)
3.5 Write down the modal value for ‘royalties paid’. Give your answer in number format / figures without words. (2)
3.6 Express the gold amount paid on royalties as a percentage of the total amount paid on royalties. (3)
3.7 Calculate the probability (expressed as a percentage) of randomly selecting a type of ‘metals and minerals’ that had less than 19 500 direct employees in 2019. (3)
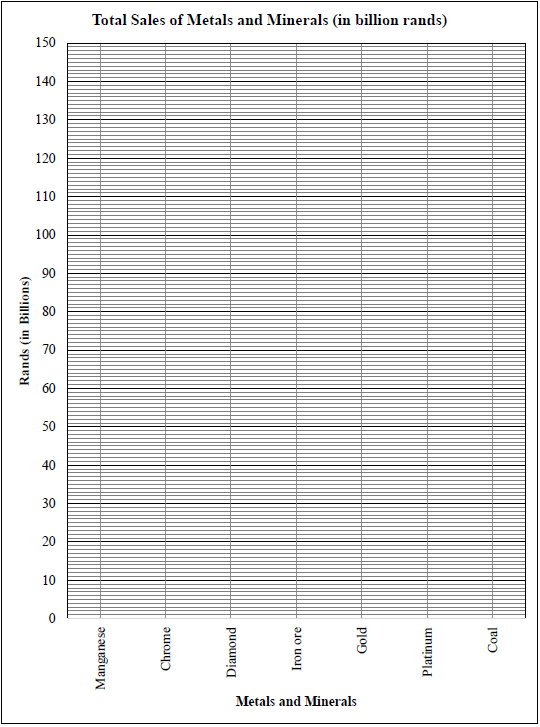
3.8 On ANSWER SHEET 1 draw a broken line graph showing the total sales for all metals and mineral industries mentioned above. (4)
3.9 Determine the difference in tons between the ‘Production’ of iron ore and gold for the year 2019. (3)
[29]
QUESTION 4
4.1
Sipho is working at Shining Cars Car Wash and has the following wage options: He receives R20 for every car that he washes, OR R200 per day plus R10 per car that he washes. The equations representing the options are:
|
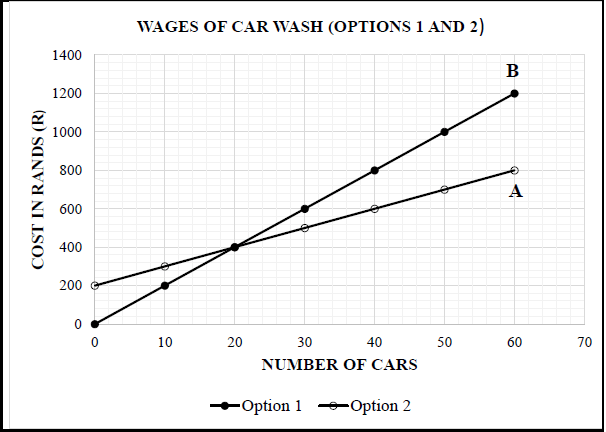
Use the above information and the graph to answer the questions that follow.
4.1.1 Write down the graph which indicates option 1 and option 2. Use letters A and B. (2)
4.1.2 Explain the meaning of break-even point in this context. (2)
4.1.3 Sipho opted for wage option 2. He washed 12 cars on the first day. Verify, showing all calculations or by use of the graph that if he had chosen option 1, he would have earned R80 less for the day. (6)
4.2
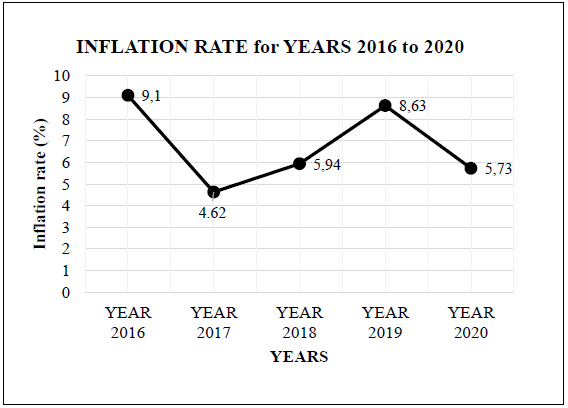
The average inflation rate for South Africa for the period 2016 to 2020 is indicated in the graph below. SOUTH AFRICA’S AVERAGE RATE OF INFLATION FROM 2016 TO 2020
[Source: Statista.com /370515/Inflation rate in South Africa] |
Use the above information on the graph to answer the questions that follow.
4.2.1 Explain why it is referred to as the average inflation rate. (2)
4.2.2 Briefly explain the changes in the rate of inflation and the impact it had on the prices of goods from 2016 to 2019. (4)
4.2.3 The price of a dining table was R5 356 in 2018. Use the rates of inflation shown above to calculate the difference in its price in 2017 and 2019.
You may use the formula:
New price = Old price × (100% + Inflation rate %) (7)
4.3 The following graph shows the Consumer Price Inflation (CPI) of South Africa, Nigeria, and Botswana for the period January 2020 until March 2021.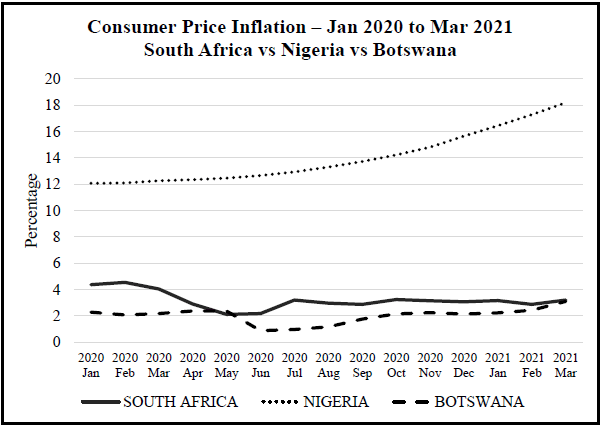
Study the graph above and answer the questions that follow.
4.3.1 Identify the country with the highest Consumer Price Inflation (CPI) over the period shown in the graph. (2)
4.3.2 Write down the month and year when the CPI of South Africa and Botswana was the closest to each other. (2)
4.3.3 Describe the trend of:
- Nigeria (from April 2020 until March 2021) (2)
- South Africa (from March 2020 until July 2020) (3)
[32]
QUESTION 5
5.1
TABLE 5 below shows the rates of tax that individuals in South Africa are liable to pay for the 2020/2021 tax year. |
TABLE 5: TAX RATES FOR INDIVIDUALS – 1 MARCH 2020 TO 28 FEBRUARY 2021
Rates applicable to individuals 2021 tax year (1 March 2020 – 28 February 2021) | |
Taxable Income (R) | Rates of Tax (R) |
1 – 205 900 | 18% of taxable income |
205 901 – 321 600 | 37 062 + 26% of taxable income above 205 900 |
321 601 – 445 100 | 67 144 + 31% of taxable income above 321 600 |
445 101 – 584 200 | 105 429 + 36% of taxable income above 445 100 |
584 201 – 744 800 | 155 505 + 39% of taxable income above 584 200 |
744 801 – 1 577 300 | 218 139 + 41% of taxable income above 744 800 |
1 577 301 and above | 559 464 + 45% of taxable income above 1 577 300 |
Age Category Rebates Tax threshold * Below age 65 R14 958 R83 100 * Age 65 to below 75 R8 199 R128 650 * Age 75 and older R2 736 R143 850 | |
Use the information in TABLE 5 above to answer the questions that follow.
5.1.1 Mr Buti, a 55-year-old salesman earned a gross income of R27 678 per month during the 2020/2021 tax year. A monthly deduction of 7,5% was made from his salary and paid into his pension fund.
Show, by means of calculations, that Mr Buti’s monthly tax was R4 037,38. You may use the formula:
Taxable Income = Annual Gross Income – Annual Pension (8)
5.1.2 Mr Buti is a member of a union and has a savings policy with an insurance company. In addition to his monthly tax of R4 037,38, he pays the following:
- Union Membership fee: R106 per month
- Savings policy premium: R585,64 per month
Hence, calculate Mr Buti’s monthly net income. (4)
5.2
A Grade 12 Mathematical Literacy class was taught how to use BMI (Body Mass Index), growth charts and weight status chart based on BMI in a data handling lesson.
|
Use the information above, Growth chart in ANNEXURE C and weight status TABLE 6 in ANNEXURE D to answer the questions that follow.
5.2.1 Mary and Jolly interpreted their weight status using their data, growth charts and TABLE 6 for weight status and had the following opinions:
- Mary: Both are at risk of overweight
- Jolly: Both are overweight
Verify, by giving explanations, whose interpretation is correct. (5)
5.2.2 Use the growth chart to estimate by how many BMI-points Mary will need to reduce her BMI to get to the 85th percentile, if she plans to achieve her target by her 19th birthday. (4)
5.3 Study the table below showing the number of adult individuals aged 20 and older who have attained a tertiary qualification by type of qualification and population group in 2016.
Type of qualification | Black African | Coloured | Indian/ Asian | White | Total |
Certificates/Diplomas | 449 218 | 54 756 | 37 931 | 215 200 | 757 105 |
Degrees | 613 820 | 75 336 | 91 125 | 569 114 | 1 349 395 |
TOTAL | 1 063 038 | 130 092 | 129 056 | 784 314 | … |
[Adapted from www.statssa.gov.za]
5.3.1 Calculate the total number of adult individuals who attained tertiary qualifications. (2)
5.3.2 Explain the meaning of the term ‘probability’. (2)
5.3.3 Determine the probability (as a decimal) of randomly selecting a Black African with a degree from all the individuals with a degree. (3)
[28]
TOTAL: 150
ANSWER SHEET 1 (QUESTION 3.8)