Mathematical Literacy Paper 1 Addendum - Grade 12 September 2021 Preparatory Exams
Share via Whatsapp Join our WhatsApp Group Join our Telegram GroupADDENDUM
ANNEXURE A: QUESTION 1.4
DEMOGRAPHICS:
TABLE 1: POPULATION COUNTED IN CENSUS 1996, 2001 AND 2011 BY PROVINCE
Year | WC | EC | NC | FS | KZN | NW | GP | MP | LP | SA |
1996 | 3 956 875 | 6 147 244 | 1 011 864 | 2 633 504 | 8 572 302 | 2 727 223 | 7 834 125 | 3 123 869 | 4 576 566 | 40 583 573 |
2001 | 4 524 335 | 6 278 651 | 991 919 | 2 706 775 | 8 584 129 | 2 984 098 | 9 388 854 | 3 365 554 | 4 995 462 | 44 819 778 |
2011 | 5 822 734 | 6 562 053 | 1 145 861 | 2 745 590 | 10 267 300 | 3 509 953 | 12 272 263 | 4 039 939 | 5 404 868 | 51 770 560 |
[Source: SASTAT 2021]
ANNEXURE B: QUESTION 2.3
GMT Missions Shelter: Financial Report | |||
For period 1 March 2020 – 28 February 2021 | |||
INCOME | EXPENSES | ||
Item | Amount (in Rand) | Item | Amount (in Rand) |
Member donations: | Salary for house matron | 114 859,00 | |
-> Local | 101 677,00 | Salaries for casual labour | 123 567,00 |
-> Foreign | 91 785,00 | Rates | 14 600,00 |
Subsidy from the local municipality | 453 000,00 | Electricity and water | 23 982,00 |
Telephone | 3 679,00 | ||
Stationery/postage | 1 650,00 | ||
Bank charges | 1 080,00 | ||
Food | 146 912,00 | ||
School uniforms | 17 244,00 | ||
Clothing | 43 432,00 | ||
Maintenance and gardening | 12 456,00 | ||
Transport costs | 23 678,00 | ||
TOTAL INCOME | 646 462,00 | TOTAL EXPENSES | … |
ANNEXURE C: QUESTION 5.2
GROWTH CHART AND WEIGHT STATUS TABLE
Girls: 2–20 years
BMI – for – age chart: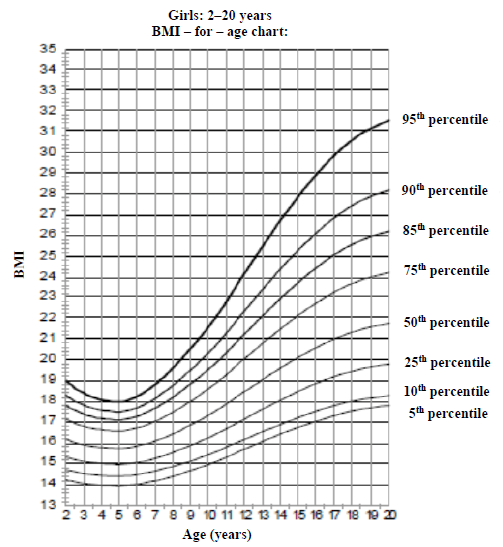
ANNEXURE D: QUESTION 5.2
TABLE 6: WEIGHT STATUS
BMI FOR AGE PERCENTAGE RANGE | WEIGHT STATUS |
< 5th percentile | Underweight |
5th percentile to 85th percentile | Healthy |
85th percentile to 95th percentile | Risk of overweight |
≥ 95th percentile | Overweight |